
Concept explainers
Videos
a)
To find the null and alternative hypotheses.
a)
Answer to Problem 9.70RE
Explanation of Solution
Given:
Sample size = n = 1500
Confidence level = 0.95
Claim: Proportion is more than
Null and alternative hypothesis:
This corresponding to a right-tailed test, for which a z-test for one population proportion needs to be used.
b)
To find the sampling distribution of proportion and draw a Normal curve.
b)
Answer to Problem 9.70RE
Explanation of Solution
Given:
Sample size = n = 1500
Confidence level = 0.95
Formula:
Mean:
Standard deviation:
2 standard deviation from the mean:
Calculation:
The mean =
The standard deviation:
Therefore,
So, standard normal curve is,
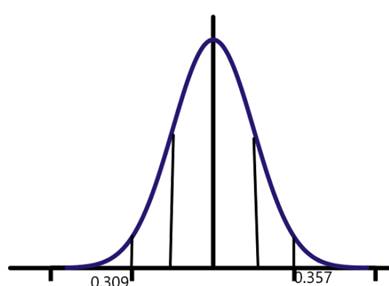
c)
To draw a actual value of
c)
Explanation of Solution
Given:
Formula:
Calculation:
The graph becomes,
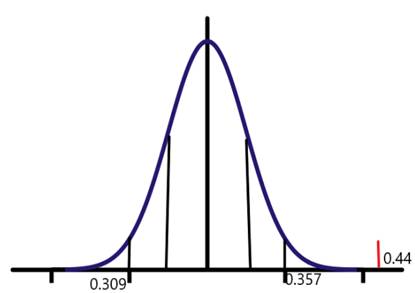
d)
To perform hypothesis test for one sample proportion
d)
Answer to Problem 9.70RE
There is sufficient evidence to support the claim that more than 1/3 of all adults would use alternative medicine if traditional medicine did not produce the results they wanted.
Explanation of Solution
Given:
n=1500
Confidence level = 0.95
Formula:
Test statistic:
Calculation:
Null and alternative hypothesis:
This corresponding to a one-tailed test, for which a z-test for one population proportion needs to be used.
Test statistic:
Test statistic z = 8.76
Using the P-value approach:
The p-value is p = 0
Using excel formula, =NORMSDIST(8.76)
And a = 0.05
Since p = 0<0.05, it is concluded that the Null Hypothesis isrejected.
Conclusion: There is sufficient evidence to support the claim that more than 1/3 of all adults would use alternative medicine if traditional medicine did not produce the results they wanted.
Chapter 9 Solutions
Statistics Through Applications
Additional Math Textbook Solutions
Statistics for Business and Economics (13th Edition)
Fundamentals of Statistics (5th Edition)
Basic Business Statistics, Student Value Edition
Statistics: The Art and Science of Learning from Data (4th Edition)
Basic Business Statistics, Student Value Edition (13th Edition)


 MATLAB: An Introduction with ApplicationsStatisticsISBN:9781119256830Author:Amos GilatPublisher:John Wiley & Sons Inc
 Probability and Statistics for Engineering and th...StatisticsISBN:9781305251809Author:Jay L. DevorePublisher:Cengage Learning
 Statistics for The Behavioral Sciences (MindTap C...StatisticsISBN:9781305504912Author:Frederick J Gravetter, Larry B. WallnauPublisher:Cengage Learning
 Elementary Statistics: Picturing the World (7th E...StatisticsISBN:9780134683416Author:Ron Larson, Betsy FarberPublisher:PEARSON
 The Basic Practice of StatisticsStatisticsISBN:9781319042578Author:David S. Moore, William I. Notz, Michael A. FlignerPublisher:W. H. Freeman
 Introduction to the Practice of StatisticsStatisticsISBN:9781319013387Author:David S. Moore, George P. McCabe, Bruce A. CraigPublisher:W. H. Freeman