
Concept explainers
Videos
a)
To find the mean and standard deviation of the proportion
a)
Answer to Problem 9.4E
Mean = 0.7 and standard deviation = 0.0144
Explanation of Solution
Given:
A USA Today poll asked a random sample of 1012 U.S. adults what they do with the milk in the bowl after they have eaten the cereal. Suppose that 70% of all U.S. adults actually drink the cereal milk.
Formula:
Mean:
Standard deviation:
Calculation:
Sample proportion =
The mean =
The standard deviation:
b)
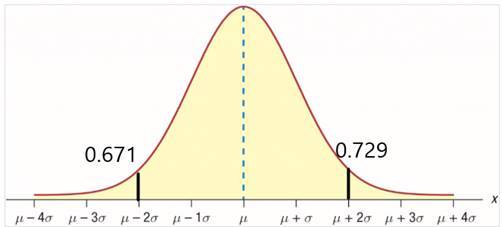
To draw a Normal curve that shows the sampling distribution of fits in this case.
b)
Explanation of Solution
Given:
Mean = 0.7 and standard deviation = 0.0144
Formula:
2 standard deviation from the mean:
Calculation:
Therefore,
So, standard normal curve is,
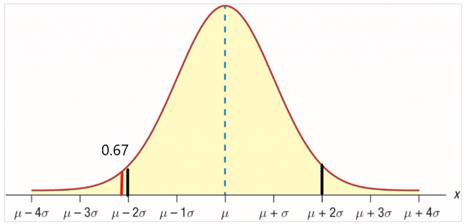
c)
To plot the sample result on plot.
c)
Explanation of Solution
Given:
Mean = 0.7 and standard deviation = 0.0144
Population proportion = 0.67
Calculation:
d)
To find the probability that sample in which 67% or fewer say they drink the cereal milk.
d)
Explanation of Solution
Given:
Mean = 0.7 and standard deviation = 0.0144
Population proportion = 0.67
Formula:
Calculation:
First we need to find z-score,
Therefore,
P(Z<-2.08) = 0.0188 …Using excel formula, =NORMSDIST(-2.08)
This probability is less than 0.05, which indicate that the true population proportion is likely to be p = 0.70
Chapter 9 Solutions
Statistics Through Applications
Additional Math Textbook Solutions
Introductory Statistics (2nd Edition)
Intro Stats, Books a la Carte Edition (5th Edition)
Basic Business Statistics, Student Value Edition
Introductory Statistics
Elementary Statistics Using Excel (6th Edition)
Introductory Statistics


 MATLAB: An Introduction with ApplicationsStatisticsISBN:9781119256830Author:Amos GilatPublisher:John Wiley & Sons Inc
 Probability and Statistics for Engineering and th...StatisticsISBN:9781305251809Author:Jay L. DevorePublisher:Cengage Learning
 Statistics for The Behavioral Sciences (MindTap C...StatisticsISBN:9781305504912Author:Frederick J Gravetter, Larry B. WallnauPublisher:Cengage Learning
 Elementary Statistics: Picturing the World (7th E...StatisticsISBN:9780134683416Author:Ron Larson, Betsy FarberPublisher:PEARSON
 The Basic Practice of StatisticsStatisticsISBN:9781319042578Author:David S. Moore, William I. Notz, Michael A. FlignerPublisher:W. H. Freeman
 Introduction to the Practice of StatisticsStatisticsISBN:9781319013387Author:David S. Moore, George P. McCabe, Bruce A. CraigPublisher:W. H. Freeman