
Concept explainers
Videos
To draw 10 intervals that illustrate the meaning of 80% confidence.
Answer to Problem 9.8E
Explanation of Solution
Given:
Confidence level = 0.80
Formula:
Calculation:
First need findzc for confidence level = 0.80
So, level of significance = a = 0.20
Therefore,
zc = z a/2 = 1.28 …Using excel formula, =ABS(NORMSINV(0.2/2))
Therefore,
The boundaries of 80% confidence interval that are symmetric about the population mean the between +/- 1.28 standard deviations from mean.
That is,
The possible graph will be,
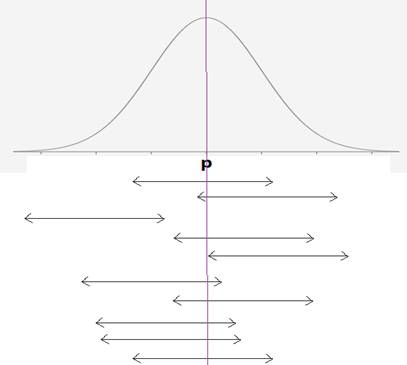
That means, 8 out of 10 confidence interval contains true population proportion p.
Chapter 9 Solutions
Statistics Through Applications
Additional Math Textbook Solutions
An Introduction to Mathematical Statistics and Its Applications (6th Edition)
Essentials of Statistics, Books a la Carte Edition (5th Edition)
Elementary Statistics
Basic Business Statistics, Student Value Edition (13th Edition)
Intro Stats, Books a la Carte Edition (5th Edition)


 MATLAB: An Introduction with ApplicationsStatisticsISBN:9781119256830Author:Amos GilatPublisher:John Wiley & Sons Inc
 Probability and Statistics for Engineering and th...StatisticsISBN:9781305251809Author:Jay L. DevorePublisher:Cengage Learning
 Statistics for The Behavioral Sciences (MindTap C...StatisticsISBN:9781305504912Author:Frederick J Gravetter, Larry B. WallnauPublisher:Cengage Learning
 Elementary Statistics: Picturing the World (7th E...StatisticsISBN:9780134683416Author:Ron Larson, Betsy FarberPublisher:PEARSON
 The Basic Practice of StatisticsStatisticsISBN:9781319042578Author:David S. Moore, William I. Notz, Michael A. FlignerPublisher:W. H. Freeman
 Introduction to the Practice of StatisticsStatisticsISBN:9781319013387Author:David S. Moore, George P. McCabe, Bruce A. CraigPublisher:W. H. Freeman