
Statistics for Engineers and Scientists
4th Edition
ISBN: 9780073401331
Author: William Navidi Prof.
Publisher: McGraw-Hill Education
expand_more
expand_more
format_list_bulleted
Concept explainers
Videos
Textbook Question
Chapter 9.1, Problem 20E
The following MINITAB output presents a power calculation.
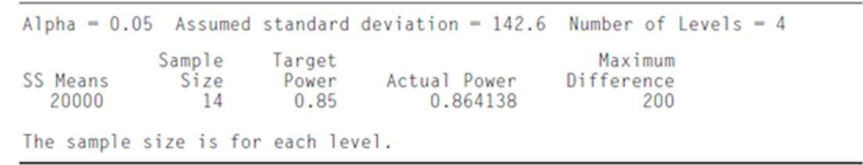
- a. What is the power requested by the experimenter?
- b. To guarantee a power of 0.864138, how many observations must be taken for all treatments combined?
- c. What is the difference between treatment means that can be detected with a power of at least 0.864138?
- d. Is the power to detect a maximum difference of 250 greater than 0.864138 or less than 0.864138? Explain.
Expert Solution & Answer
Want to see the full answer?
Check out a sample textbook solution
Students have asked these similar questions
Consider the case where the predetermined average number of bus arrivals at the Cubao Station is 6 per 15-minute period. Find the pro of at least 4 buses arriving in a 15-minute period.
Kaitlyn measures the upload speed in megabits per second of her home broadband internet connection during peak hours and off-peak hours. The results are provided in the accompanying table.
Peak
Off-Peak
5.83
5.14
6.05
6.80
7.14
6.98
3.54
5.77
5.45
7.27
5.90
6.62
5.81
6.19
4.82
6.08
6.37
6.59
4.65
5.58
5.30
7.41
6.48
6.26
5.96
6.37
5.79
6.31
6.84
6.55
5.06
4.95
5.61
7.03
6.45
6.77
Examine the results of Kaitlyn's test to determine the statements that compare the medians and interquartile ranges of the data sets to each other in terms of this situation. Select the two correct answers.
The median upload speed during peak hours is 5.905 megabits per second, which is less than the median upload speed during off-peak hours, 7.005 megabits per second. The upload speeds during peak hours are slower on average compared to off-peak times.
The median upload speed during peak hours is 6.37 megabits per second, which is greater than the median upload speed during…
The following data have been collected on the number of times that owner-occupied and renter-occupied units had a water supply stoppage lasting or more hours over a -month period.
Number of Units (1,000s)
Number of Times
Owner Occupied
Renter Occupied
0
548
23
1
5,012
541
2
6,110
3,734
3
2,544
8,660
4 times or more
557
3,784
Do not round intermediate calculations. Round your answers to two decimal places.
a. Define a random variable number of times that owner-occupied units had a water supply stoppage lasting or more hours in the past months and develop a probability distribution for the random variable. (Let represent or more times.)
x
f(x)
0
1
2
3
4
Total
b. Compute the expected value and variance for x.
E(x)
Var(x)
c. Define a random variable number of times that renter-occupied units had a water supply stoppage lasting or more hours in the past months and develop a probability…
Chapter 9 Solutions
Statistics for Engineers and Scientists
Ch. 9.1 - A study is made of the effect of curing...Ch. 9.1 - The article Nutrient Deprivation Improves Field...Ch. 9.1 - Prob. 3ECh. 9.1 - The antibiotic gentamicin sulphate is often...Ch. 9.1 - The article influence of Age on Masonry Bond...Ch. 9.1 - Archaeologists can determine the diets of ancient...Ch. 9.1 - The article Secretion of Parathyroid Hormone...Ch. 9.1 - The article Impact of Free Calcium Oxide Content...Ch. 9.1 - A certain chemical reaction was run three times at...Ch. 9.1 - An experiment to compare the lifetimes of four...
Ch. 9.1 - Prob. 11ECh. 9.1 - Prob. 12ECh. 9.1 - Prob. 13ECh. 9.1 - Prob. 14ECh. 9.1 - Refer to Exercise 12. a. Compute the quantity...Ch. 9.1 - Prob. 16ECh. 9.1 - Prob. 17ECh. 9.1 - Prob. 18ECh. 9.1 - Prob. 19ECh. 9.1 - The following MINITAB output presents a power...Ch. 9.2 - Exercises for Section 9.2 1.The article Organic...Ch. 9.2 - The article Optimum Design of an A-pillar Trim...Ch. 9.2 - Prob. 3ECh. 9.2 - Refer to Exercise 2 in Section 9.1. a.Use the...Ch. 9.2 - Refer to Exercise 13 in Section 9.1. a. Use the...Ch. 9.2 - Refer to Exercise 1 in Section 9.1. A scientist...Ch. 9.2 - Refer to Exercise 13 in Section 9.1. A...Ch. 9.2 - Refer to Exercise 3 in Section 9.1. a. Use the...Ch. 9.2 - Refer to Exercise 5 in Section 9.1. a. Use the...Ch. 9.2 - Refer to Exercise 9 in Section 9.1. a. Use the...Ch. 9.2 - Refer to Exercise 16 in Section 9.1. a. Use the...Ch. 9.2 - Refer to Exercise 18 in Section 9.1. a. Use the...Ch. 9.2 - In an experiment to determine the effect of...Ch. 9.2 - In an experiment to determine the effect of curing...Ch. 9.2 - Prob. 15ECh. 9.2 - For some data sets, the F statistic will reject...Ch. 9.3 - To assess the effect of piston ring type and oil...Ch. 9.3 - A machine shop has three machines used in...Ch. 9.3 - An experiment to determine the effect of mold...Ch. 9.3 - The effect of curing pressure on bond strength was...Ch. 9.3 - The article Change in Creep Behavior of Plexiform...Ch. 9.3 - Prob. 6ECh. 9.3 - Prob. 7ECh. 9.3 - Adding glass panicles to clay brick may improve...Ch. 9.3 - The article Application of Radial Basis Function...Ch. 9.3 - Prob. 10ECh. 9.3 - Prob. 11ECh. 9.3 - The article Anodic Fenton Treatment of Treflan MTF...Ch. 9.3 - Refer to Exercise 12. The treatments with a...Ch. 9.3 - The article Use of Taguchi Methods and Multiple...Ch. 9.3 - The article T-Bracing for Stability of Compression...Ch. 9.3 - The article referred to in Exercise 15 also...Ch. 9.3 - Prob. 17ECh. 9.3 - Prob. 18ECh. 9.3 - The article Cellulose Acetate Microspheres...Ch. 9.4 - Recycling newsprint is important in reducing...Ch. 9.4 - A study was done to see which of four machines is...Ch. 9.4 - Prob. 3ECh. 9.4 - Three different corrosion-resistant coatings are...Ch. 9.4 - The article Genotype-Environment Interactions and...Ch. 9.4 - The article Sprinkler Technologies, Soil...Ch. 9.4 - The article Bromate Surveys in French Drinking...Ch. 9.4 - The article Multi-objective Scheduling Problems:...Ch. 9.4 - You have been given the task of designing a study...Ch. 9.4 - An engineering professor wants to determine which...Ch. 9.5 - Prob. 1ECh. 9.5 - Give an example of a factorial experiment in which...Ch. 9.5 - Prob. 3ECh. 9.5 - The article Efficient Pyruvate Production by a...Ch. 9.5 - The article cited in Exercise 4 also investigated...Ch. 9.5 - A metal casting process for the production of...Ch. 9.5 - The article An Investigation into the Ball...Ch. 9.5 - In a 2p design with one replicate per treatment,...Ch. 9.5 - Prob. 9ECh. 9.5 - Prob. 10ECh. 9.5 - The article Factorial Design for Column Rotation...Ch. 9.5 - Prob. 12ECh. 9.5 - Prob. 13ECh. 9 - The article Gypsum Effect on the Aggregate Size...Ch. 9 - Prob. 2SECh. 9 - Prob. 3SECh. 9 - Prob. 4SECh. 9 - Prob. 5SECh. 9 - Prob. 6SECh. 9 - Prob. 7SECh. 9 - The article Case Study Based Instruction of DOE...Ch. 9 - The article Combined Analysis of Real-Time...Ch. 9 - Vermont maple sugar producers sponsored a testing...Ch. 9 - Prob. 11SECh. 9 - Prob. 12SECh. 9 - Prob. 13SECh. 9 - The article Enthalpies and Entropies of Transfer...Ch. 9 - Prob. 15SECh. 9 - Prob. 16SECh. 9 - The article Factorial Experiments in the...Ch. 9 - The Williamsburg Bridge is a suspension bridge...Ch. 9 - Prob. 19SECh. 9 - In the article Nitrate Contamination of Alluvial...Ch. 9 - The article Factorial Experiments in the...Ch. 9 - Prob. 22SECh. 9 - Prob. 23SECh. 9 - Prob. 24SE
Additional Math Textbook Solutions
Find more solutions based on key concepts
(a) Make a stem-and-leaf plot for these 24 observations on the number of customers who used a down-town CitiBan...
Applied Statistics in Business and Economics
(a) For each data set, find the mean, median, and mode. (b) Discuss anything about the data that affects the us...
APPLIED STAT.IN BUS.+ECONOMICS
31. Putting It Together: A Tornado Model Is the width of a tornado related to the amount of distance for which ...
Statistics: Informed Decisions Using Data (5th Edition)
Ten equally qualified marketing assistants are candidates for promotion to associate buyer; seven are men and t...
An Introduction to Mathematical Statistics and Its Applications (6th Edition)
A father rates his daughter as a 2 on a 7-point scale (from 1 to 7) of crankiness. In this example, (a) what is...
Statistics for Psychology
the type of variable is the response.
Stats: Modeling the World Nasta Edition Grades 9-12
Knowledge Booster


Learn more about
Need a deep-dive on the concept behind this application? Look no further. Learn more about this topic, statistics and related others by exploring similar questions and additional content below.Similar questions
- the following data represent the operating time in hours fro 4 types of pocket calculators before a recharge is required. test at 0.01 level of significance if the operating times for all four calculators are equal. Find the following: MSbet: Mswit: Fratio: F0.01: Decision:arrow_forwardThere was a compete e^AT partarrow_forwardThe owner of Kat Motel wants to develop a time standard for the task of cleaning a cat cage. In a preliminary study, she observed one of her workers perform this task six times, with the following results: Observation 1 2 3 4 5 6 Time(Seconds) 99 87 90 81 93 90 _____ is the standard time for this task if the employee worked at a 150 PRF, and an allowance of 20 percent of job time is used. _____ is the normal time for this task if the employee worked at 150 PRF. _____ is the standard time for this task if the employee worked at a 150 PRF and an allowance of 10 percent of the workday is used.arrow_forward
- The table below summarizes data from a survey of a sample of women. Using a 0.01significance level, and assuming that the sample sizes of 800 men and 300 women are predetermined, test the claim that the proportions of agree/disagree responses are the same for subjects interviewed by men and the subjects interviewed by women. Does it appear that the gender of the interviewer affected the responses of women? Gender of Interviewer Man Woman Women who agree 498 247 Women who disagree 302 53 Compute the test statistic, rounding to three decimal places. Find the critical value(s). (Round to three decimal places) What is the conclusion based on the hypothesis test?arrow_forwardA marketing research group found that 25% of the 200 shoppers, it recently interviewed at a certain shopping center, resided more than 12 miles from the center. Assume that a random sample was taken, construct a 95% C.I. for the actual; percentage of shoppers who live more than 15 miles from that center.arrow_forwardAckerman and Goldsmith (2011) report that students who study from a screen (phone, tablet, or computer) tended to have lower quiz scores than students who studied the same material from printed pages. To test this finding, a professor identifies a sample of n = 16 students who used the electronic version of the course textbook and determines that this sample had an average score of M = 72.5 on the final exam. During the previous three years, the final exam scores for the general population of students taking the course averaged μ =77with a standard deviation of σ = 8 and formed a roughly normal distribution. The professor would like to use the sample to determine whether students studying from an electronic screen had exam scores that are significantly different from those for the general population. 1. Using the standard four-step procedure, conduct a two-tailed hypothesis test with αto evaluate the effect of studying from an electronic screen.arrow_forward
- At any age, about 20% of American adults participate in physical conditioning activities at least twice a week. However, these activities change as people get older, and occasionally participants cease to be older as they age. In a local survey of n = 100 adults over 40 years of age, a total of 15 people indicated that they participated in these activities at least twice a week. Does this data indicate that the percentage of participation for adults over 40 years of age is considerably less than the 20% figure? Find the p-value and use it to draw the appropriate conclusions.arrow_forwardPet Owners A study of pet owners showed the following information concerning the ownership of the dogs and cats. At =α0.10 , is there a relationship between the number of people in a family and dog or cat ownership? Use the critical value method with tables. 1 person 2 people 3 people 4 or more people Dog 5 15 10 25 Cat 10 15 15 15 1)State the hypotheses and identify the claim. H0: Pet ownership is ▼(DEPENDANT ON or INDEPENDANT OF?) the number of people living in the household. (CLAIM OR NOT CLAIM?) H1 : Pet ownership is (DEPENDANT ON or INDEPENDANT OF?) the number of people living in the household. (CLAIM OR NOT CLAIM?) 2. Find the critical value 3. Compute the test value: X^2= 4. Reject or Do not reject the null hypothesis 5. Summarize: Is there or is there not enough evidence to reject the claim?Is there or is there not enough evidence to support the claim?arrow_forwardA research center claims that 26% of adults in a certain country would travel into space on a commercial flight if they could afford it. In a random sample of 1000 adults in that country, 29% say that they would travel into space on a commercial flight if they could afford it. At α=0.05, is there enough evidence to reject the research center's claim? Complete parts (a) through (d) below. (a) Identify the claim and state H0 and Ha. "Recall that the claim is the percentage of adults in the country would travel into space on a commercial flight if they could afford it. Let a success be an adult in the country who would travel into space on a commercial flight if they could afford it. Translate the claim made about the population parameter from a verbal statement to a mathematical statement." (b) Use technology to find the P-value. (c) Decide whether to reject or fail to reject the null hypothesis and (d) interpret the decision in the context of the original claim.arrow_forward
- Recent surveys have shown a decline in the percentage of U.S. households withcable TV. In one city, a simple random sample of 468 households had 117households reporting they had cable TV, and 351 households reporting they didnot.(a) Show the “plug-in” box to represent our best guess for the relative frequency ofpeople with and without cable. (Let 1 correspond to with cable and 0 without).(b) The percentage of households in the city with cable TV is estimated to be___________%, and this estimate is likely to be off by about ___________% or so.(c) A 90%-confidence interval for the percentage of households in the city withcable TV goes from ___________% to ___________%.arrow_forwardFormulate the null and alternate hypotheses for the following situations. (identify the correct number θ0 and write H0: θ = θ0 and the appropriate analogous expression for H1).- The average farm size in a predominantly rural state was 280,851.8 square meter. The secretary of agriculture of that state assures that today it is less. - A statistics instructor believes that less than 20% of the students attended the opening function of a film. He surveys 84 of his students and finds that 11 attended the function. Thanksarrow_forward2/12 decide if a 90% T interval can be constructed about the population mean. If not, state the reason why.arrow_forward
arrow_back_ios
SEE MORE QUESTIONS
arrow_forward_ios
Recommended textbooks for you
 MATLAB: An Introduction with ApplicationsStatisticsISBN:9781119256830Author:Amos GilatPublisher:John Wiley & Sons Inc
 Probability and Statistics for Engineering and th...StatisticsISBN:9781305251809Author:Jay L. DevorePublisher:Cengage Learning
 Statistics for The Behavioral Sciences (MindTap C...StatisticsISBN:9781305504912Author:Frederick J Gravetter, Larry B. WallnauPublisher:Cengage Learning
 Elementary Statistics: Picturing the World (7th E...StatisticsISBN:9780134683416Author:Ron Larson, Betsy FarberPublisher:PEARSON
 The Basic Practice of StatisticsStatisticsISBN:9781319042578Author:David S. Moore, William I. Notz, Michael A. FlignerPublisher:W. H. Freeman
 Introduction to the Practice of StatisticsStatisticsISBN:9781319013387Author:David S. Moore, George P. McCabe, Bruce A. CraigPublisher:W. H. Freeman
MATLAB: An Introduction with Applications
Statistics
ISBN:9781119256830
Author:Amos Gilat
Publisher:John Wiley & Sons Inc
Probability and Statistics for Engineering and th...
Statistics
ISBN:9781305251809
Author:Jay L. Devore
Publisher:Cengage Learning
Statistics for The Behavioral Sciences (MindTap C...
Statistics
ISBN:9781305504912
Author:Frederick J Gravetter, Larry B. Wallnau
Publisher:Cengage Learning
Elementary Statistics: Picturing the World (7th E...
Statistics
ISBN:9780134683416
Author:Ron Larson, Betsy Farber
Publisher:PEARSON
The Basic Practice of Statistics
Statistics
ISBN:9781319042578
Author:David S. Moore, William I. Notz, Michael A. Fligner
Publisher:W. H. Freeman
Introduction to the Practice of Statistics
Statistics
ISBN:9781319013387
Author:David S. Moore, George P. McCabe, Bruce A. Craig
Publisher:W. H. Freeman
Mod-01 Lec-01 Discrete probability distributions (Part 1); Author: nptelhrd;https://www.youtube.com/watch?v=6x1pL9Yov1k;License: Standard YouTube License, CC-BY
Discrete Probability Distributions; Author: Learn Something;https://www.youtube.com/watch?v=m9U4UelWLFs;License: Standard YouTube License, CC-BY
Probability Distribution Functions (PMF, PDF, CDF); Author: zedstatistics;https://www.youtube.com/watch?v=YXLVjCKVP7U;License: Standard YouTube License, CC-BY
Discrete Distributions: Binomial, Poisson and Hypergeometric | Statistics for Data Science; Author: Dr. Bharatendra Rai;https://www.youtube.com/watch?v=lHhyy4JMigg;License: Standard Youtube License