
Statistics for Engineers and Scientists
4th Edition
ISBN: 9780073401331
Author: William Navidi Prof.
Publisher: McGraw-Hill Education
expand_more
expand_more
format_list_bulleted
Videos
Textbook Question
Chapter 9.5, Problem 11E
The article “Factorial Design for Column Rotation of Phosphate Wastes” (N. Abdel-Khalek, Particulate Science and Technology, 2000:57–70) describes a 23 factorial design to investigate the effect of superficial air velocity (A), frothier concentration (B), and superficial wash water velocity (C) on the percent recovery of P2O5. There were two replicates. The data are presented in the following table.
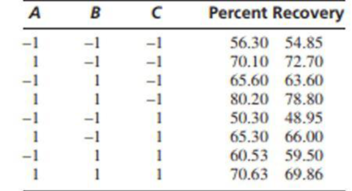
- a. Compute estimates of the main effects and interactions, along with their sums of squares and P-values.
- b. Which factors seem to be most important? Do the important factors interact? Explain.
Expert Solution & Answer
Want to see the full answer?
Check out a sample textbook solution
Students have asked these similar questions
1. In the book Design and Analysis of Experiments, 8th edition (2012, John Wiley & Sons), the results of an experiment involving a storage battery used in the launching mechanism of a shoulder-fired ground-to-air missile were presented. Three material types can be used to make the battery plates. The objective is to design a battery that is relatively unaffected by the ambient temperature. The output response from the battery is effective life in hours. Three temperature levels are selected, and a factorial experiment with four replicates is run. The data are as follows: Table 11.(a) Test the appropriate hypotheses and draw conclusions using the analysis ether either firing temperature or furnace position affects the baked density of a carbon anode. The data are as follows: Table 12.(a) State the hypotheses of interest. (b) Test the hypotheses in part (a) using the analysis of variance with a = 0.05. What are your conclusions? (c) Analyze the residuals from this experiment. (d)…
A paper investigated the driving behavior of teenagers by observing their vehicles as they left a high school parking lot and then again at a site approximately
1
2
mile from the school. Assume that it is reasonable to regard the teen drivers in this study as representative of the population of teen drivers.
MaleDriver
FemaleDriver
1.4
-0.2
1.2
0.5
0.9
1.1
2.1
0.7
0.7
1.1
1.3
1.2
3
0.1
1.3
0.9
0.6
0.5
2.1
0.5
(a) Use a .01 level of significance for any hypothesis tests. Data consistent with summary quantities appearing in the paper are given in the table. The measurements represent the difference between the observed vehicle speed and the posted speed limit (in miles per hour) for a sample of male teenage drivers and a sample of female teenage drivers. (Use ?males − ?females. Round your test statistic to two decimal places. Round your degrees of freedom down to the nearest whole number. Round your p-value to three decimal places.)
t
=
df
=…
A paper investigated the driving behavior of teenagers by observing their vehicles as they left a high school parking lot and then again at a site approximately
1
2
mile from the school. Assume that it is reasonable to regard the teen drivers in this study as representative of the population of teen drivers.
MaleDriver
FemaleDriver
1.3
-0.3
1.3
0.6
0.9
1.1
2.1
0.7
0.7
1.1
1.3
1.2
3
0.1
1.3
0.9
0.6
0.5
2.1
0.5
(a) Use a .01 level of significance for any hypothesis tests. Data consistent with summary quantities appearing in the paper are given in the table. The measurements represent the difference between the observed vehicle speed and the posted speed limit (in miles per hour) for a sample of male teenage drivers and a sample of female teenage drivers. (Use ?males − ?females. Round your test statistic to two decimal places. Round your degrees of freedom down to the nearest whole number. Round your p-value to three decimal places.)
t
=
df
=…
Chapter 9 Solutions
Statistics for Engineers and Scientists
Ch. 9.1 - A study is made of the effect of curing...Ch. 9.1 - The article Nutrient Deprivation Improves Field...Ch. 9.1 - Prob. 3ECh. 9.1 - The antibiotic gentamicin sulphate is often...Ch. 9.1 - The article influence of Age on Masonry Bond...Ch. 9.1 - Archaeologists can determine the diets of ancient...Ch. 9.1 - The article Secretion of Parathyroid Hormone...Ch. 9.1 - The article Impact of Free Calcium Oxide Content...Ch. 9.1 - A certain chemical reaction was run three times at...Ch. 9.1 - An experiment to compare the lifetimes of four...
Ch. 9.1 - Prob. 11ECh. 9.1 - Prob. 12ECh. 9.1 - Prob. 13ECh. 9.1 - Prob. 14ECh. 9.1 - Refer to Exercise 12. a. Compute the quantity...Ch. 9.1 - Prob. 16ECh. 9.1 - Prob. 17ECh. 9.1 - Prob. 18ECh. 9.1 - Prob. 19ECh. 9.1 - The following MINITAB output presents a power...Ch. 9.2 - Exercises for Section 9.2 1.The article Organic...Ch. 9.2 - The article Optimum Design of an A-pillar Trim...Ch. 9.2 - Prob. 3ECh. 9.2 - Refer to Exercise 2 in Section 9.1. a.Use the...Ch. 9.2 - Refer to Exercise 13 in Section 9.1. a. Use the...Ch. 9.2 - Refer to Exercise 1 in Section 9.1. A scientist...Ch. 9.2 - Refer to Exercise 13 in Section 9.1. A...Ch. 9.2 - Refer to Exercise 3 in Section 9.1. a. Use the...Ch. 9.2 - Refer to Exercise 5 in Section 9.1. a. Use the...Ch. 9.2 - Refer to Exercise 9 in Section 9.1. a. Use the...Ch. 9.2 - Refer to Exercise 16 in Section 9.1. a. Use the...Ch. 9.2 - Refer to Exercise 18 in Section 9.1. a. Use the...Ch. 9.2 - In an experiment to determine the effect of...Ch. 9.2 - In an experiment to determine the effect of curing...Ch. 9.2 - Prob. 15ECh. 9.2 - For some data sets, the F statistic will reject...Ch. 9.3 - To assess the effect of piston ring type and oil...Ch. 9.3 - A machine shop has three machines used in...Ch. 9.3 - An experiment to determine the effect of mold...Ch. 9.3 - The effect of curing pressure on bond strength was...Ch. 9.3 - The article Change in Creep Behavior of Plexiform...Ch. 9.3 - Prob. 6ECh. 9.3 - Prob. 7ECh. 9.3 - Adding glass panicles to clay brick may improve...Ch. 9.3 - The article Application of Radial Basis Function...Ch. 9.3 - Prob. 10ECh. 9.3 - Prob. 11ECh. 9.3 - The article Anodic Fenton Treatment of Treflan MTF...Ch. 9.3 - Refer to Exercise 12. The treatments with a...Ch. 9.3 - The article Use of Taguchi Methods and Multiple...Ch. 9.3 - The article T-Bracing for Stability of Compression...Ch. 9.3 - The article referred to in Exercise 15 also...Ch. 9.3 - Prob. 17ECh. 9.3 - Prob. 18ECh. 9.3 - The article Cellulose Acetate Microspheres...Ch. 9.4 - Recycling newsprint is important in reducing...Ch. 9.4 - A study was done to see which of four machines is...Ch. 9.4 - Prob. 3ECh. 9.4 - Three different corrosion-resistant coatings are...Ch. 9.4 - The article Genotype-Environment Interactions and...Ch. 9.4 - The article Sprinkler Technologies, Soil...Ch. 9.4 - The article Bromate Surveys in French Drinking...Ch. 9.4 - The article Multi-objective Scheduling Problems:...Ch. 9.4 - You have been given the task of designing a study...Ch. 9.4 - An engineering professor wants to determine which...Ch. 9.5 - Prob. 1ECh. 9.5 - Give an example of a factorial experiment in which...Ch. 9.5 - Prob. 3ECh. 9.5 - The article Efficient Pyruvate Production by a...Ch. 9.5 - The article cited in Exercise 4 also investigated...Ch. 9.5 - A metal casting process for the production of...Ch. 9.5 - The article An Investigation into the Ball...Ch. 9.5 - In a 2p design with one replicate per treatment,...Ch. 9.5 - Prob. 9ECh. 9.5 - Prob. 10ECh. 9.5 - The article Factorial Design for Column Rotation...Ch. 9.5 - Prob. 12ECh. 9.5 - Prob. 13ECh. 9 - The article Gypsum Effect on the Aggregate Size...Ch. 9 - Prob. 2SECh. 9 - Prob. 3SECh. 9 - Prob. 4SECh. 9 - Prob. 5SECh. 9 - Prob. 6SECh. 9 - Prob. 7SECh. 9 - The article Case Study Based Instruction of DOE...Ch. 9 - The article Combined Analysis of Real-Time...Ch. 9 - Vermont maple sugar producers sponsored a testing...Ch. 9 - Prob. 11SECh. 9 - Prob. 12SECh. 9 - Prob. 13SECh. 9 - The article Enthalpies and Entropies of Transfer...Ch. 9 - Prob. 15SECh. 9 - Prob. 16SECh. 9 - The article Factorial Experiments in the...Ch. 9 - The Williamsburg Bridge is a suspension bridge...Ch. 9 - Prob. 19SECh. 9 - In the article Nitrate Contamination of Alluvial...Ch. 9 - The article Factorial Experiments in the...Ch. 9 - Prob. 22SECh. 9 - Prob. 23SECh. 9 - Prob. 24SE
Additional Math Textbook Solutions
Find more solutions based on key concepts
(a) Make a stem-and-leaf plot for these 24 observations on the number of customers who used a down-town CitiBan...
Applied Statistics in Business and Economics
Ten equally qualified marketing assistants are candidates for promotion to associate buyer; seven are men and t...
An Introduction to Mathematical Statistics and Its Applications (6th Edition)
Teacher Salaries
The following data from several years ago represent salaries (in dollars) from a school distri...
Elementary Statistics: A Step By Step Approach
In Exercises 5-36, express all probabilities as fractions.
23. Combination Lock The typical combination lock us...
Elementary Statistics
In Exercises 5-36, express all probabilities as fractions.
23. Combination Lock The typical combination lock us...
Essentials of Statistics, Books a la Carte Edition (5th Edition)
10. Explain the steps in designing an experiment.
Fundamentals of Statistics (5th Edition)
Knowledge Booster


Learn more about
Need a deep-dive on the concept behind this application? Look no further. Learn more about this topic, statistics and related others by exploring similar questions and additional content below.Similar questions
- The article “Withdrawal Strength of Threaded Nails” (D. Rammer, S. Winistorfer, and D. Bender, Journal of Structural Engineering 2001:442–449) describes an experiment comparing the ultimate withdrawal strengths (in N/mm) for several types of nails. For an annularly threaded nail with shank diameter 3.76 mm driven into spruce-pine-fir lumber, the ultimate withdrawal strength was modeled as lognormal with μ = 3.82 and σ = 0.219. For a helically threaded nail under the same conditions, the strength was modeled as lognormal with μ = 3.47 and σ = 0.272. a) What is the mean withdrawal strength for annularly threaded nails? b) What is the mean withdrawal strength for helically threaded nails? c) For which type of nail is it more probable that the withdrawal strength will be greater than 50 N/mm? d) What is the probability that a helically threaded nail will have a greater withdrawal strength than the median for annularly threaded nails? e) An experiment is performed in which withdrawal…arrow_forwardA U.S. Food Survey showed that Americans routinely eat beef in their diet. Suppose that in a study of 49 consumers in Illinois and 64 consumers in Texas the following results were obtained from two samples regarding average yearly beef consumption: Illinois Texas = 49 = 64 = 54.1lb = 60.4lb S1 = 7.0 S2 = 8.0 Formulate a hypothesis so that, if the null hypothesis is rejected, we can conclude that the average amount of beef eaten annually by consumers in Illinois is significantly less than that eaten by consumers in Texas.arrow_forward27. An article in Radio Engineering and Electronic Physics (1980, Vol. 25, pp. 74-79) investigated the behavior of a stochastic generator in the presence of external noise. The number of periods was measured in a sample of 100 trains for each of two different levels of noise voltage, 100 and 150 mV. For 100 mV, the mean number of periods in a train was 7.9 with s1 = 2.6. For 150 mV, the mean was 6.9 with s2 = 2.4. Use α = 0.01 and assume that each population is normally distributed and the two population variances are equal. (a) It was originally suspected that raising noise voltage would reduce mean number of periods. Do the data support this claim? (b) Calculate a confidence interval to answer the question in part (a).arrow_forward
- A group of high-risk automobile drivers (with three moving violations in one year) are required, according to random assignment, either to attend a traffic school or to perform supervised volunteer work. During the subsequent five-year period, these same drivers were cited for the following number of moving violations: NUMBER OF MOVING VIOLATIONS TRAFFIC SCHOOL VOLUNTEER WORK 0 26 0 7 15 4 9 1 7 1 0 14 2 6 23 10 7 8 Why might the Mann–Whitney U test be preferred to the t test for these data? Use U to test the null hypothesis at the .05 level of significance. Specify the approximate p-value for this test result.arrow_forwardIn the Chernobyl nuclear accident it is estimated that 30,000 people received an average dose of 45 REM. For this population, using the linear hypothesis, how many "normal" deaths from cancer are expected and how many additional deaths from the radiation of the accident? Group of answer choices 500 normal, 6000 additional 1000 normal, 4000 additional 2000 normal, 3000 additional 4000 normal, 1000 additional 6000 normal, 500 additionalarrow_forwardIn a study attempting to replicate findings by Stephens, Atkins, & Kingston (2009), each participant was asked to plunge a hand into the icy water and keep it there as long as the pain would allow. In one condition, the participants repeated their favorite curse words while their hands were in the water. In the other condition, they repeated neutral words. The original research showed that, in addition to lowering the participants’ perception of pain, swearing also increased the amount of time they were able to tolerate the pain. Data similar to the results obtained in the study are shown in the following table: _____________Amount of Time (in Seconds)_ Participant Swear Words Neutral Words 1 94 59 2 70 61 3 52 47 4…arrow_forward
- In a study attempting to replicate findings by Stephens, Atkins, & Kingston (2009), each participant was asked to plunge a hand into the icy water and keep it there as long as the pain would allow. In one condition, the participants repeated their favorite curse words while their hands were in the water. In the other condition, they repeated neutral words. The original research showed that, in addition to lowering the participants’ perception of pain, swearing also increased the amount of time they were able to tolerate the pain. Data similar to the results obtained in the study are shown in the following table: _____________Amount of Time (in Seconds)_ Participant Swear Words Neutral Words 1 94 59 2 70 61 3 52 47 4…arrow_forwardA local church is interested in determining how length of residence in the present community relates to church attendance. Using a random sample of 15 individuals, they gathered data on how many times in the previous 5 weeks each individual attended church services. The data are provided below. Length of residence in the community Less than 2 years 2-5 years More than 5 years 0 0 1 1 2 3 3 3 3 4 4 4 4 5 4 Using the 5-step model, determine whether and how church attendance is related to length of residence in the community. Use 5% and 1% levels of statistical significance. What are the assumptions for this problem?arrow_forwardIn the book Business Research Methods (5th ed.), Donald R. Cooper and C. William Emory discuss studying the relationship between on-the-job accidents and smoking. Cooper and Emory describe the study as follows: Suppose a manager implementing a smoke-free workplace policy is interested in whether smoking affects worker accidents. Since the company has complete reports of on-the-job accidents, she draws a sample of names of workers who were involved in accidents during the last year. A similar sample from among workers who had no reported accidents in the last year is drawn. She interviews members of both groups to determine if they are smokers or not. The sample results are given in the following table. On-the-Job Accident Smoker Yes No Row Total Heavy 12 5 17 Moderate 9 10 19 Nonsmoker 13 17 30 Column total 34 32 66 Expected counts are below observed counts Accident No Accident Total Heavy 12 5 17 8.76 8.24…arrow_forward
- 19. A local brewery produces three premium lagers named Half Pint, XXX, and Dark Knight. Of its premium lagers, the brewery bottles 40% Half Pint, 40% XXX, and 20% Dark Knight. In a marketing test of a sample of 80 consumers, 26 preferred the Half Pint lager, 42 preferred the XXX lager, and 12 preferred the Dark Night lager. Using a chi-square goodness-of-fit test, test whether the production of the premium lagers matches these consumer preferences using a .05 level of significance. 19a. Step 2: Compute the df and locate the critical values. df = _______ Critical value = ________arrow_forward19. A local brewery produces three premium lagers named Half Pint, XXX, and Dark Knight. Of its premium lagers, the brewery bottles 40% Half Pint, 40% XXX, and 20% Dark Knight. In a marketing test of a sample of 80 consumers, 26 preferred the Half Pint lager, 42 preferred the XXX lager, and 12 preferred the Dark Night lager. Using a chi-square goodness-of-fit test, test whether the production of the premium lagers matches these consumer preferences using a .05 level of significance. 19. Step 1: Which of the following is the correct set of hypotheses?A. H0: The preferences will not match production (40% Half Pint, 40% XXX, 20% Dark Knight); and H1: The preferences will match production B. H0: \mu_{1}μ1 = \mu_{2}μ2 = \mu_{3}μ3; and H1: At least one of the categories will be different than the others C. H0: The preferences will match production (40% Half Pint, 40% XXX, 20% Dark Knight); and H1: The preferences will not match production 19b. Step 2: Compute the df and locate the…arrow_forward19. A local brewery produces three premium lagers named Half Pint, XXX, and Dark Knight. Of its premium lagers, the brewery bottles 40% Half Pint, 40% XXX, and 20% Dark Knight. In a marketing test of a sample of 80 consumers, 26 preferred the Half Pint lager, 42 preferred the XXX lager, and 12 preferred the Dark Night lager. Using a chi-square goodness-of-fit test, test whether the production of the premium lagers matches these consumer preferences using a .05 level of significance. 19. Step 3: Compute the test statistic -- Chi-square χ2 = (use 2 decimal places) _____________ Step 4: Decision and Conclusions 19. Step 4: Decision: A. Reject H0 B. Retain H0 19. Step 5: Conclusion: Did the production of the premium lagers match consumer preferences? A. Yes. The observed frequencies did not differ from the expected frequencies. B. No. The observed frequencies differed from the expected frequencies.arrow_forward
arrow_back_ios
SEE MORE QUESTIONS
arrow_forward_ios
Recommended textbooks for you
 MATLAB: An Introduction with ApplicationsStatisticsISBN:9781119256830Author:Amos GilatPublisher:John Wiley & Sons Inc
 Probability and Statistics for Engineering and th...StatisticsISBN:9781305251809Author:Jay L. DevorePublisher:Cengage Learning
 Statistics for The Behavioral Sciences (MindTap C...StatisticsISBN:9781305504912Author:Frederick J Gravetter, Larry B. WallnauPublisher:Cengage Learning
 Elementary Statistics: Picturing the World (7th E...StatisticsISBN:9780134683416Author:Ron Larson, Betsy FarberPublisher:PEARSON
 The Basic Practice of StatisticsStatisticsISBN:9781319042578Author:David S. Moore, William I. Notz, Michael A. FlignerPublisher:W. H. Freeman
 Introduction to the Practice of StatisticsStatisticsISBN:9781319013387Author:David S. Moore, George P. McCabe, Bruce A. CraigPublisher:W. H. Freeman
MATLAB: An Introduction with Applications
Statistics
ISBN:9781119256830
Author:Amos Gilat
Publisher:John Wiley & Sons Inc
Probability and Statistics for Engineering and th...
Statistics
ISBN:9781305251809
Author:Jay L. Devore
Publisher:Cengage Learning
Statistics for The Behavioral Sciences (MindTap C...
Statistics
ISBN:9781305504912
Author:Frederick J Gravetter, Larry B. Wallnau
Publisher:Cengage Learning
Elementary Statistics: Picturing the World (7th E...
Statistics
ISBN:9780134683416
Author:Ron Larson, Betsy Farber
Publisher:PEARSON
The Basic Practice of Statistics
Statistics
ISBN:9781319042578
Author:David S. Moore, William I. Notz, Michael A. Fligner
Publisher:W. H. Freeman
Introduction to the Practice of Statistics
Statistics
ISBN:9781319013387
Author:David S. Moore, George P. McCabe, Bruce A. Craig
Publisher:W. H. Freeman
Hypothesis Testing using Confidence Interval Approach; Author: BUM2413 Applied Statistics UMP;https://www.youtube.com/watch?v=Hq1l3e9pLyY;License: Standard YouTube License, CC-BY
Hypothesis Testing - Difference of Two Means - Student's -Distribution & Normal Distribution; Author: The Organic Chemistry Tutor;https://www.youtube.com/watch?v=UcZwyzwWU7o;License: Standard Youtube License