
Concept explainers
Videos
Hip Fracture Rates. In the paper “Very Low Rates of Hip Fracture in Beijing, People’s Republic of China,” L. Xu, A. Lu, X. Zhao, X. Chen, and S. Cummings present the results of a study on the rates of hip fracture for women and men in Beijing for the years 1990–1992 (American Journal of Epidemiology, 144, pp. 901–907). For this analysis, we consider only the hip fracture rates for women.
The following table gives the annual rate of hip fractures (per 100,000 population) for women in 14 age groups.
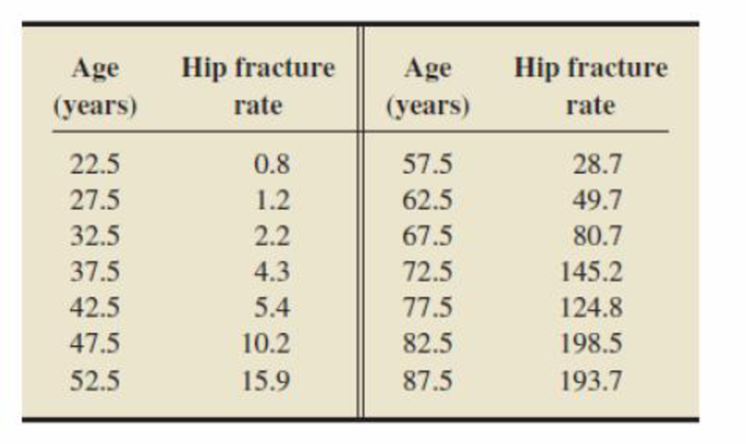
To relate hip fracture rate to age, we use the midpoint age for each age group, as depicted in the table. The
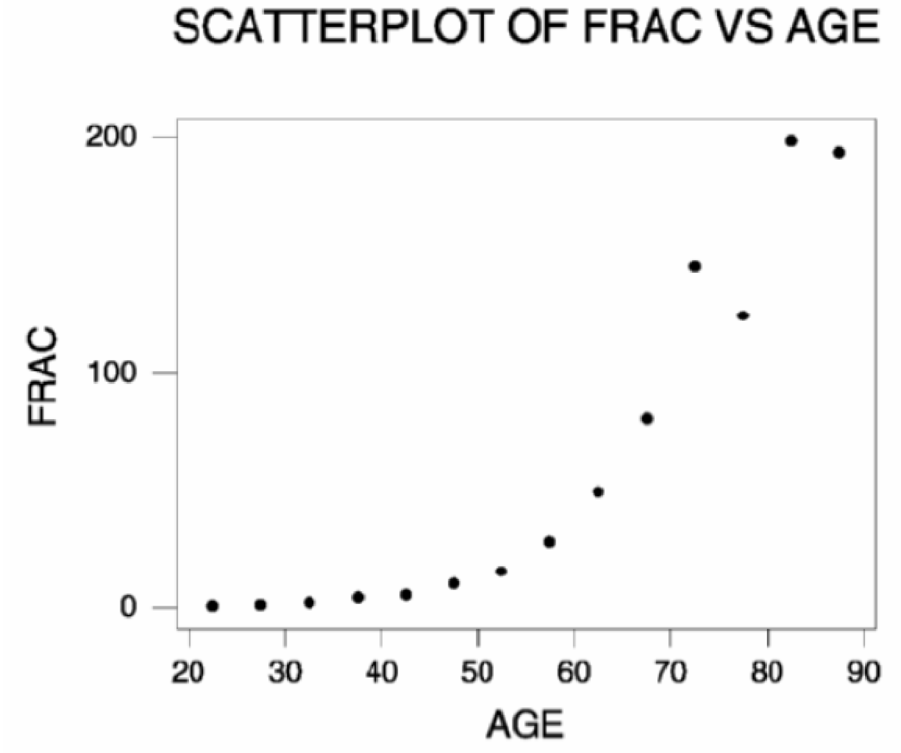
- a. In view of Output B.20, which transformations should be attempted on frac? on age?
- b. A draftsman plot of powers of frac versus powers of age is shown in Output B.21 on page B-29. Based on these plots, which pairs of transformed variables would you consider for further analysis? Explain your reasoning.
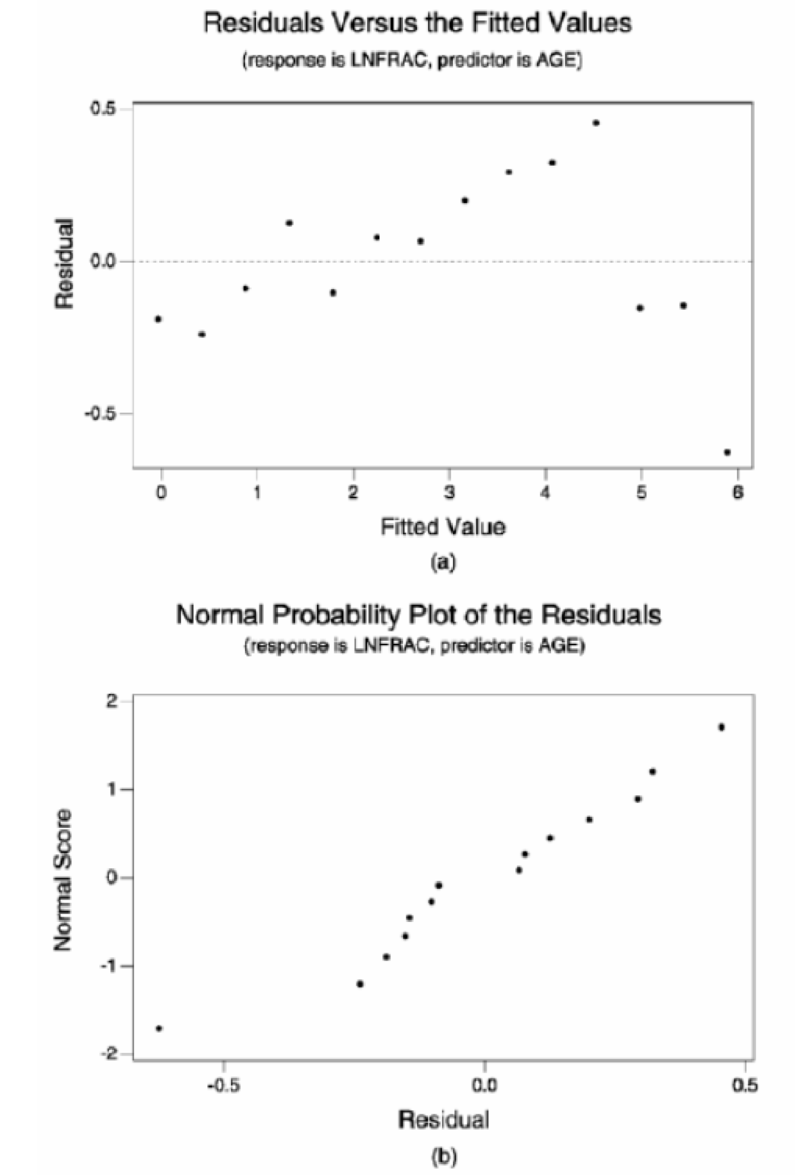
- c. The scatterplot of ln (frac) versus age appears to be fairly straight. We performed a regression of ln(frac) on age as shown in Output B.22 on page B-30. Outputs B.23(a) and (b) on page B-31 provide, respectively, a plot of residuals versus lilted values and a normal probability plot of the residuals. Perform a residual analysis to assess the assumptions of linearity of the regression constancy of the equation, conditional standard deviation, and normality of the conditional distributions. Check for outliers and influential observations.
- d. Does your analysis in part (c) reveal any violations of the assumptions for regression inferences? Explain y our answer.
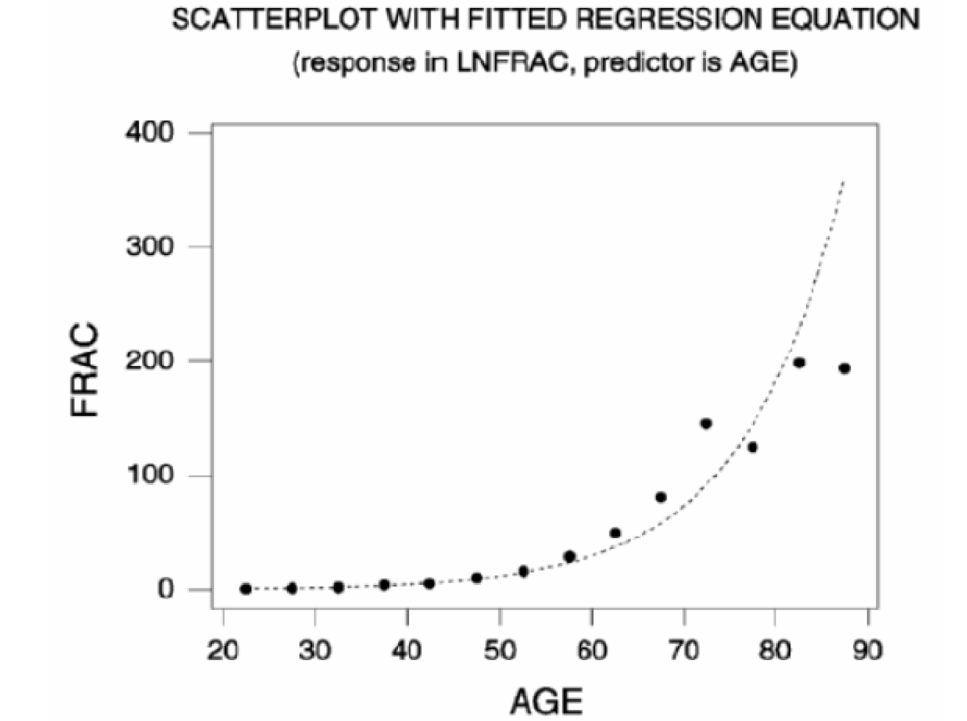
- e. Refer to the plot of the regression equation of ln(frac) on age displayed on the scatterplot in Output B.24 on page B-31. Based on this plot and the results of the residual analysis in parts (c) and (d), is the transformation in part (c) effective at straightening the scatterplot? Explain y our answer.
OUTPUT B.20
Scatterplot of frac versus age for Exercise B.25
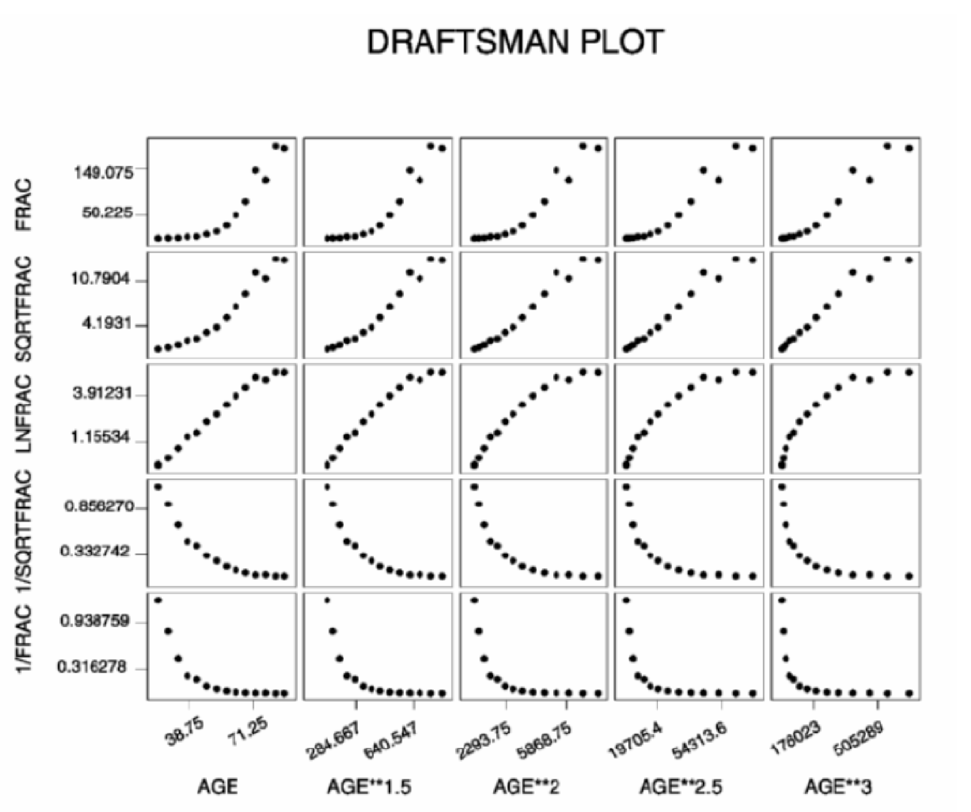
OUTPUT B.21
Draft plot for Exercise B.25
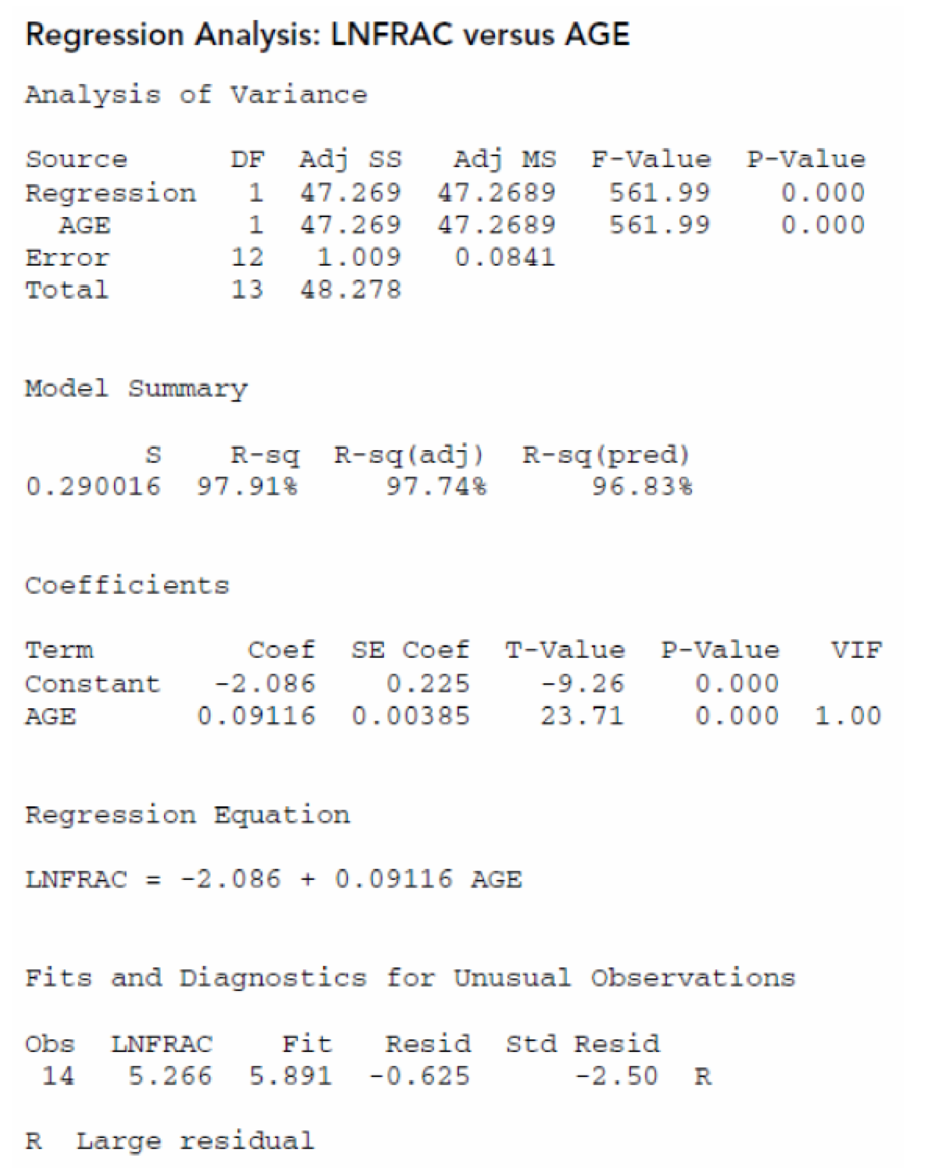
OUTPUT B.22
Output off regression of ln(frac) on age for Exercise B.25
OUTPUT B.23
Residual plots for Exercise B.25
OUTPUT B.24
Scatterplot and plot of regression equation for Exercise B.25
Want to see the full answer?
Check out a sample textbook solution
Chapter B Solutions
Introductory Statistics (10th Edition)


- Peanut Allergies. In the article “Food Allergy Advice May Be Peanuts” (Science News, Vol. 174, No. 12, pp. 8–9), N. Seppa reports that early exposure to peanuts seems to lessen the risk of nut allergy. Of 4000 Jewish children sampled in Britain, 1.85% had peanut allergies; and of 4600 Jewish children sampled in Israel, where early peanut consumption is more common, 0.17% had peanut allergies. The researcher chose Jewish children in both countries to limit genetic differences between groups. a. Is this study descriptive or inferential? b. Is this study observational or experimental?arrow_forwardApplying the Concepts and SkillsUse the technology of your choice to solve Problems.Smoking and Cotinine. Smoking during pregnancy is hazardousto both the mother and baby. Passive smoking, or inhalation of second-hand smoke, is also a concern. In the article “Detection of Cotinine in Neonate Meconium as a Marker for Nicotine Exposure in Utero” (Eastern Mediterranean Health Journal, Vol. 10, No. 1/2, pp. 96–105), N. Sherif et al. studied whether activesmoking or passive-smoking mothers were passing along harmful chemicals to their babies. The level of cotinine in a newborn’s first meconium, which is the infant’s stool, is reported on the WeissStats site for independent samples of active-, passive-, and nonsmoking mothers. Cotinine levels are measured in nanograms per milliliter (ng/mL). Decide whether presuming that the assumptions of normal populations and equal population standard deviations are met is reasonable.arrow_forwardIn a population-based cohort study, an entire community was interviewed regarding smoking habits and then followed for one year. Upon ascertainment of all lung cancer deaths, the investigator obtained the following data: Number of Individuals Lung Cancer Deaths Smokers 24,500 15 Nonsmokers 10,500 2 Calculate the risk difference per 100,000 per year. Round to the tenth decimaarrow_forward
- In ongoing economic analyses, the U.S. federal government compares per capita incomes not only among different states but also for the same state at different times. Typically, what the federal government finds is that "poor" states tend to stay poor and "wealthy" states tend to stay wealthy. Would we have been able to predict the 1999 per capita income for a state (denoted by y ) from its 1980 per capita income (denoted by x )? The following bivariate data give the per capita income (in thousands of dollars) for a sample of fourteen states in the years 1980 and 1999 (source: U.S. Bureau of Economic Analysis, Survey of Current Business, May 2000 ). The data are plotted in the scatter plot in Figure 1, and the least-squares regression line is drawn. The equation for this line is =y+0.382.75x . 1980 per capita income, x(in $1000s) 1999 per capita income, y(in $1000s) South Dakota 8.1 25.1 Utah 8.5 23.4 West Virginia 8.2 20.9…arrow_forward2.Researchers studied selenium levels in beef raised in a low selenium region of the United States. The goal of the study was to compare selenium levels in the region-raised beef to selenium levels in cooked venison, squirrel, and beef from other regions of the United States. The data in the Excel file (se_level.xlsx or se_level.txt) are the selenium levels calculated on a dry weight basis in mg=100 g for a sample of 53 region-raised cattle 11.23 29.63 20.42 10.12 39.91 32.66 38.38 36.21 16.39 27.44 17.29 56.20 28.94 20.11 25.35 21.77 31.62 32.63 30.31 46.16 56.61 24.47 29.39 40.71 18.52 27.80 19.49 15.82 27.74 22.35 34.78 35.09 32.60 37.03 27.00 44.20 13.09 33.03 9.69 32.45 37.38 34.91 27.99 22.36 22.68 26.52 46.01 38.04 30.88 30.04 25.91 18.54 25.51 Please answer the following questions: Describe these data with…arrow_forwardquestion (9): A researcher was interested in the effect of job security on stress. The researcher recruited a random sample of 10 individuals who had job security and 10 individuals who were employed on a 1 year contract. The researcher measured the stress hormone through a saliva sample. This is an independent sample design; TRUE OR FALSEarrow_forward
- In ongoing economic analyses, the federal government compares per capita incomes not only among different states but also for the same state at different times. Typically, what the federal government finds is that "poor" states tend to stay poor and "wealthy" states tend to stay wealthy. Would we have gotten information about the 1999 per capita income for a state (denoted by y ) from its 1980 per capita income (denoted by x)? The following bivariate data give the per capita income (in thousands of dollars) for a sample of fifteen states in the years 1980 and 1999 (source: U.S. Bureau of Economic Analysis, Survey of Current Business, May 2000). The data are plotted in the scatter plot in Figure 1. Also given is the product of the 1980 per capita income and the 1999 per capita income for each of the fifteen states. (These products, written in the column labelled " xy ", may aid in calculations.) Question table 1980 per capita income, x (in $1000 s) 1999 per capita…arrow_forwardLeisure Activities and Dementia. An article appearing in the Los Angeles Times discussed the study “Leisure Activities and the Risk of Dementia in the Elderly” (New England Journal of Medicine, Vol. 348, pp. 2508–2516) by J.Verghese et al. The article in the Times, titled “Crosswords Reduce Risk of Dementia,” contained the following statement: “Elderly people who frequently read, do crossword puzzles, practice a musical instrument or play board games cut their risk of Alzheimer’s and other forms of dementia by nearly two-thirds compared with people who seldom do such activities.” Comment on the statement in quotes, keeping in mind the type of study for which causation can be reasonably inferred.arrow_forward
 Functions and Change: A Modeling Approach to Coll...AlgebraISBN:9781337111348Author:Bruce Crauder, Benny Evans, Alan NoellPublisher:Cengage Learning
 Glencoe Algebra 1, Student Edition, 9780079039897...AlgebraISBN:9780079039897Author:CarterPublisher:McGraw Hill