
Videos
Graduation Rates. Refer to Exercise B.86 on page B-118, where we considered the
- a. Use the maximum-R2 criterion to obtain a regression equation for these data.
- b. Use the adjusted-R2 criterion to obtain a regression equation for these data.
- c. Use the Mallows’ Cp criterion to obtain a regression equation for these data.
- d. Do the three methods used in parts (a), (b), and (c) yield the same final regression equation?
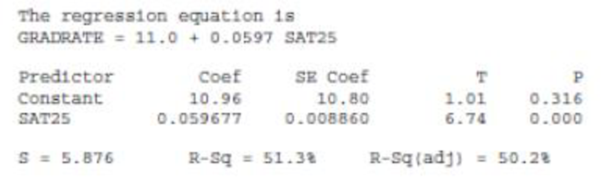
OUTPUT B.71 Output for Exercise B.86, B.100, and B.117
Predictor variable is sat25
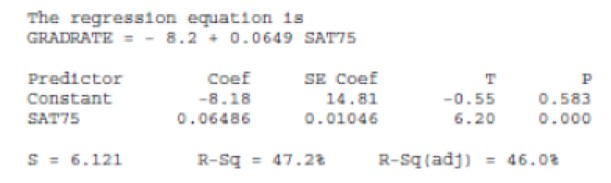
Predictor variable is sat75
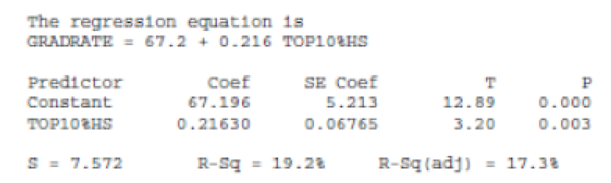
Predictor variable is top10%hs
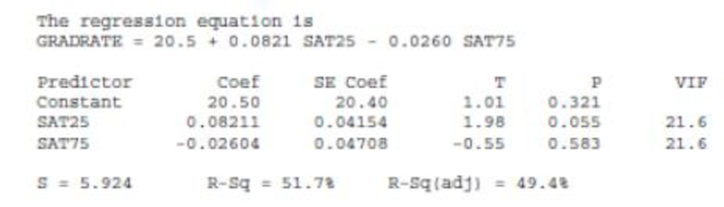
Predictor variables are sat25 and sat75
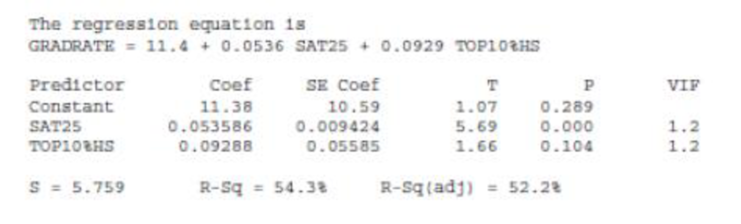
Predictor variables are sat25 and top10%hs
OUTPUT B.71 (cont.) Output for Exercise B.86, B.100, and B.117
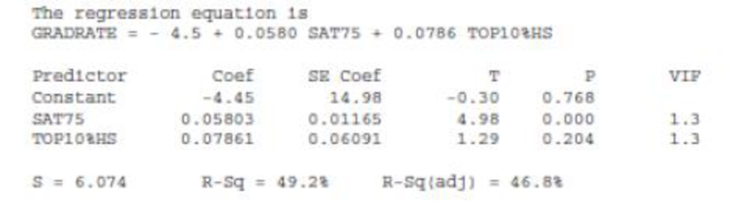
Predictor variable are sat75 and top10%hs
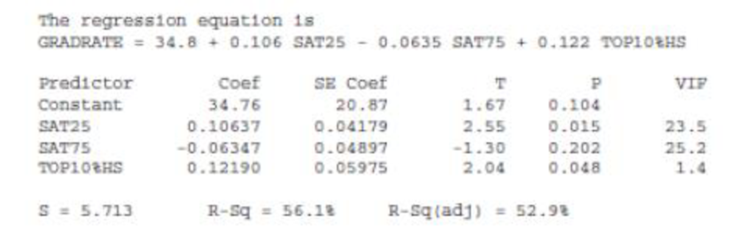
Predictor variables are sat25, sat75, and top10%hs
Want to see the full answer?
Check out a sample textbook solution
Chapter B Solutions
Introductory Statistics (10th Edition)


- Urban Travel Times Population of cities and driving times are related, as shown in the accompanying table, which shows the 1960 population N, in thousands, for several cities, together with the average time T, in minutes, sent by residents driving to work. City Population N Driving time T Los Angeles 6489 16.8 Pittsburgh 1804 12.6 Washington 1808 14.3 Hutchinson 38 6.1 Nashville 347 10.8 Tallahassee 48 7.3 An analysis of these data, along with data from 17 other cities in the United States and Canada, led to a power model of average driving time as a function of population. a Construct a power model of driving time in minutes as a function of population measured in thousands b Is average driving time in Pittsburgh more or less than would be expected from its population? c If you wish to move to a smaller city to reduce your average driving time to work by 25, how much smaller should the city be?arrow_forwardThe following fictitious table shows kryptonite price, in dollar per gram, t years after 2006. t= Years since 2006 0 1 2 3 4 5 6 7 8 9 10 K= Price 56 51 50 55 58 52 45 43 44 48 51 Make a quartic model of these data. Round the regression parameters to two decimal places.arrow_forward
 College AlgebraAlgebraISBN:9781305115545Author:James Stewart, Lothar Redlin, Saleem WatsonPublisher:Cengage Learning
 Linear Algebra: A Modern IntroductionAlgebraISBN:9781285463247Author:David PoolePublisher:Cengage Learning
 Functions and Change: A Modeling Approach to Coll...AlgebraISBN:9781337111348Author:Bruce Crauder, Benny Evans, Alan NoellPublisher:Cengage Learning