
Introductory Statistics (10th Edition)
10th Edition
ISBN: 9780321989178
Author: Neil A. Weiss
Publisher: PEARSON
expand_more
expand_more
format_list_bulleted
Concept explainers
Videos
Textbook Question
Chapter B, Problem 21RP
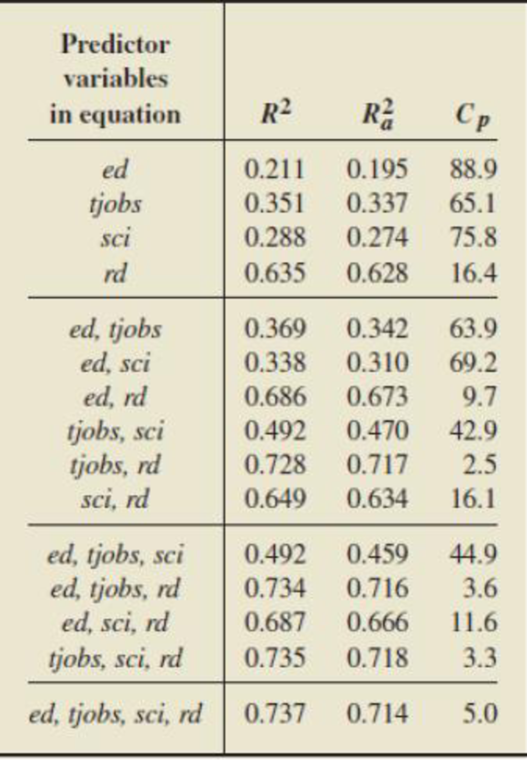
Patent Production. Refer to Problem 18. where we considered relating the number of patents per 1000 workers and four predictor variables: workforce education score, high-tech jobs, percentage of scientists and engineers in the workforce, and investment in research and development, The table below contains the values of R2,
- a. Use the maximum-R2 criterion to obtain a regression equation.
- b. Use the adjusted-R2 criterion to obtain a regression equation.
- c. Use the Mallows’ Cp criterion to obtain a regression equation,
- d. Are the regression equations that you obtained in parts (a), (b), and (c) the same?
Expert Solution & Answer
Want to see the full answer?
Check out a sample textbook solution
Students have asked these similar questions
Problem 2
The following printout shows the results of a simple linear regression model that predicts monthly sales (in thousands of dollars) based on how much money was spent on advertising (in thousands of dollars) during a particular month for 15 stores of a retail chain.
a) Is there a statistically significant relationship between money spent on advertising and sales? Test at the 5% level of significance and explain your approach (including hypotheses).
b) Somebody claims that every additional $1,000 in advertising will increase sales by more than $2,000 in the population. Can you find support for this claim given the results of your analysis? Test at the 5% level of significance and explain your approach (including hypotheses). How is this test different from the one in part a)?
c) Find a 95% confidence interval for the change in sales given a $1,000 increase in the amount of money spent on advertising. How does this confidence interval relate to your answer to part a)?
Problem 2-28A Estimating fixed and variable cost using the regression method
Dean and Powell Tax Services Company has 31 branch offices in the nation. Each office has about three to six professional accountants and one to two secretaries. In a busy season, the office manager, who is also a professional accountant, can hire temporary employees for support work such as document filing and typing. Norman Dean, the president, is wondering whether he should expand his business by opening more offices. One of the factors that he is considering is how to estimate office support costs. Andrea Jones, the accountant, collected the following cost data for all 31 offices.
Branch
Professional Hours
Support Costs
Branch
Professional Hours
Support Costs
A1
225
$4,241
F2
165
$3,856
A2
113
3,435
G1
358
5,936
A3
387
6,398
G2
471
8,615
A4
412
6,502
G3
492
9,639
B1
258
4,140
G4
328
5,968
B2
146
3,368
G5
359
7,115
B3
275
3,820
G6
174
3,287
D1…
2.state each of the five assumptions of the classical regression model (OLS) and give an intuitive explanation of the meaning and need for each of them
Chapter B Solutions
Introductory Statistics (10th Edition)
Ch. B.1 - Regarding the regression of a response variable,...Ch. B.1 - Fill in the blanks. a. The assumption that all...Ch. B.1 - Answer true or false to each of the following...Ch. B.1 - Prob. 4ECh. B.1 - In each of Exercises B.5B.14, a. decide whether...Ch. B.1 - Prob. 6ECh. B.1 - Prob. 7ECh. B.1 - In each of Exercises B.5B.14, a. decide whether...Ch. B.1 - In each of Exercises B.5B.14, a. decide whether...Ch. B.1 - In each of Exercises B.5B.14, a. decide whether...
Ch. B.1 - In each of Exercises B.5B.14, a. decide whether...Ch. B.1 - Prob. 12ECh. B.1 - In each of Exercises B.5B.14, a. decide whether...Ch. B.1 - In each of Exercises B.5B.14, a. decide whether...Ch. B.1 - Consider the scatterplot of y versus x in Output...Ch. B.1 - Consider the scatterplot of y versus x in Output...Ch. B.1 - Prob. 17ECh. B.1 - Prob. 18ECh. B.1 - If one or both of the assumptions of...Ch. B.1 - Prob. 20ECh. B.1 - Prob. 21ECh. B.1 - Prob. 22ECh. B.1 - Prob. 23ECh. B.1 - Gasoline Mileage Ratings. Gasoline mileage and...Ch. B.1 - Hip Fracture Rates. In the paper Very Low Rates of...Ch. B.1 - Prob. 26ECh. B.1 - Prob. 27ECh. B.1 - Prob. 28ECh. B.1 - Prob. 29ECh. B.1 - Gasoline Mileage Ratings. Refer to Exercise B.24,...Ch. B.1 - Hip Fracture Rates. Refer to Exercise B.25, where...Ch. B.1 - Drosophila Life-span. In the paper Extended...Ch. B.1 - Protein Content of Wheat. In their text, Methods...Ch. B.1 - Pine Tree Volume. Table B.2 on page B-5 provides...Ch. B.2 - Give an example of a. a second-degree polynomial...Ch. B.2 - In the polynomial regression equation y = 8 + 3x ...Ch. B.2 - Answer true or false to each of the following...Ch. B.2 - Explain why it is difficult to interpret the...Ch. B.2 - Fill in the blanks. a. A predictor variable is...Ch. B.2 - Answer true or false to each of the following...Ch. B.2 - Refer to the scatterplots in Outputs B.32(a) and...Ch. B.2 - Fill in the blanks. a. In the _______ method for...Ch. B.2 - Answer true or false to each of the following...Ch. B.2 - Stopping Distance. In their text Methods of...Ch. B.2 - Hour of Birth. In the paper increased Frequency of...Ch. B.2 - Silica Gel. Silica gel is a substance that absorbs...Ch. B.2 - Note: The data for the Using Technology exercises...Ch. B.2 - Hour of Birth. Refer to Exercise B.45, where the...Ch. B.2 - Silica Gel. Refer to Exercise B.46, where the...Ch. B.2 - Gasoline Mileage Ratings. Refer to Exercise B.24...Ch. B.2 - Protein Content of Wheat. Refer to Exercise B.33...Ch. B.2 - Satellite Orbits. Each issue of the magazine Ad...Ch. B.2 - Pine Tree Volume. In Example B.6 on page B-4, we...Ch. B.3 - Explain the difference between a quantitative...Ch. B.3 - In predicting a person's income, identify two...Ch. B.3 - In predicting the change in blood pressure for...Ch. B.3 - Fill in the blanks. a. A ___ predictor variable is...Ch. B.3 - Prob. 59ECh. B.3 - Answer true or false to each of the following...Ch. B.3 - For the regression equation y = 15 + 2x1 + 4x2 ...Ch. B.3 - Refer to Exercise B.61: a. Do the slopes of the...Ch. B.3 - Consider the regression equation y = 0 + 1 x1+ 2x2...Ch. B.3 - Prob. 64ECh. B.3 - Prob. 65ECh. B.3 - Prob. 66ECh. B.3 - Home Sale Prices. Refer to Example B.18 on page...Ch. B.3 - Mental Tasks and Drugs. In the text Statistical...Ch. B.3 - Gasoline Mileage Ratings. Refer to Exercise B.66...Ch. B.3 - Home Sale Prices. Refer to Exercise B.67 regarding...Ch. B.3 - Mental Tasks and Drugs. Refer to Exercise B.68...Ch. B.3 - Hip Fracture Rates. Refer to Exercise B.25 on page...Ch. B.3 - Television Viewing. The results of a study on...Ch. B.3 - Glue Strength. In the text Quality Control and...Ch. B.4 - Explain why the interpretation of the regression...Ch. B.4 - Answer true or false to each of the following...Ch. B.4 - Explain what is meant by multicollinearity.Ch. B.4 - Fill in the blanks. a. Consider a regression model...Ch. B.4 - Prob. 79ECh. B.4 - Prob. 80ECh. B.4 - Fill in the blanks. a. If predictor variable x1...Ch. B.4 - Answer true or false to each of the following...Ch. B.4 - State four ways to detect the presence of...Ch. B.4 - Prob. 84ECh. B.4 - Prob. 85ECh. B.4 - Prob. 86ECh. B.4 - Prob. 87ECh. B.4 - Prob. 88ECh. B.4 - Graduation Rates. Refer to Exercise B.86, where we...Ch. B.4 - Prob. 90ECh. B.4 - Gasoline Mileage Ratings. Refer to Exercise B.84,...Ch. B.4 - Graduation Rules. Refer to Exercise B.86, where we...Ch. B.5 - Explain what is meant by the variable selection...Ch. B.5 - Prob. 94ECh. B.5 - Fill in the blanks. a. In the forward selection...Ch. B.5 - Prob. 96ECh. B.5 - Answer true or false to each of the following...Ch. B.5 - Prob. 98ECh. B.5 - Prob. 99ECh. B.5 - Prob. 100ECh. B.5 - Prob. 101ECh. B.5 - Suppose that x1, x2, x3, and x4 are predictor...Ch. B.5 - Prob. 103ECh. B.5 - Graduation Rates. Refer to Exercise B.92 on page...Ch. B.5 - Home Sale Prices. In Example B. 18 on page B-67,...Ch. B.5 - Home Sale Prices. In Example B.18 on page B-67, we...Ch. B.5 - Infant Mortality Rates. In the article Children's...Ch. B.6 - Consider a multiple linear regression relating the...Ch. B.6 - Prob. 109ECh. B.6 - Prob. 110ECh. B.6 - Answer true or false to each of the following...Ch. B.6 - Explain the similarities and differences between...Ch. B.6 - Fill in the blanks. a. In the Mallows Cp...Ch. B.6 - Answer true or false to each of the following...Ch. B.6 - Gasoline Mileage Ratings. Refer to Exercise B.84...Ch. B.6 - Advertising and Sales. Refer to Exercise B.85 on...Ch. B.6 - Graduation Rates. Refer to Exercise B.86 on page...Ch. B.6 - Suppose that x1, x2, x3, and x4 are predictor...Ch. B.6 - Suppose that x1 x2, x3, and x4 are predictor...Ch. B.6 - Gasoline Mileage Ratings. Refer to Exercise B.91...Ch. B.6 - Graduation Rates. Refer to Exercise B.92 on page...Ch. B.6 - Home Sale Prices. Refer to Exercise B.105 on page...Ch. B.6 - Body Fat. Refer to Exercise B.106 on page B-143,...Ch. B.6 - Infant Mortality Rates. Refer to Exercise B.107 on...Ch. B.7 - List six problems that can arise in the collection...Ch. B.7 - Prob. 126ECh. B.7 - Prob. 127ECh. B.7 - Give an example of how a nonrepresentative sample...Ch. B.7 - Discuss the effect on a regression analysis of not...Ch. B.7 - Explain how multicollinearity can adversely affect...Ch. B.7 - Briefly describe what is meant by the problem of...Ch. B.7 - Answer true or false to each of the following...Ch. B.7 - Prob. 133ECh. B.7 - Discuss the advantages of using data collected...Ch. B.7 - Describe the potential effects of outliers on...Ch. B.7 - Prob. 136ECh. B.7 - Regarding regression analysis: a. What assumptions...Ch. B.7 - Answer true or false to each of the following...Ch. B.7 - Answer true or false to each of the following...Ch. B.7 - Discuss what G. E. P. Box might have meant when he...Ch. B.7 - Regarding model validation in regression: a. What...Ch. B - Explain what is meant when we say that a nonlinear...Ch. B - Answer true or false to the following statements...Ch. B - Prob. 3RPCh. B - Prob. 4RPCh. B - Answer true or false to each of the following...Ch. B - Paper Strength. In their text, Introduction to...Ch. B - Answer true or false to each of the following...Ch. B - Prob. 8RPCh. B - Explain what is meant when we say that a...Ch. B - OUTPUT B.95 Output for Problem 10 Regression...Ch. B - In regressing a response variable on several...Ch. B - Answer true or false to each of the following...Ch. B - Fill in the blanks. a. Multicollinearity is...Ch. B - Prob. 14RPCh. B - Explain why selecting a regression equation using...Ch. B - Answer true or false to each of the following...Ch. B - Fill in the blanks. a. In the _____ method, we...Ch. B - Patent Production. In the report The State New...Ch. B - Prob. 19RPCh. B - Prob. 20RPCh. B - Patent Production. Refer to Problem 18. where we...Ch. B - Prob. 22RPCh. B - Prob. 23RPCh. B - What are the possible consequences of the presence...Ch. B - Windmill Output. Refer to Problem 3, where we...Ch. B - Paper Strength. Refer to Problem 6, where we...Ch. B - Diabetes. Refer to Problem 10, where we considered...Ch. B - Hospital Stalling. Refer to Problem 14, where we...Ch. B - Patent Production. Refer to Problem 18, where we...Ch. B - Patent Production. Refer to Problem 29, where we...Ch. B - Recall from Chapter 1 of your text that the Focus...Ch. B - At the beginning of this module on page B-l, we...
Knowledge Booster


Learn more about
Need a deep-dive on the concept behind this application? Look no further. Learn more about this topic, statistics and related others by exploring similar questions and additional content below.Similar questions
- Question 5 - what is the y-intercept of the equation of the regression line y = 36.11695 + 7.20508x A. 7.20508 B. 36.11695 C. Y D. X Question 6 - what is the slop of the equation of the regression line y = 36.11695 + 7.20508x? A. 7.20508 B. 36.11695 C . Y D . Xarrow_forwardQUESTION 2 XXX Electric Illuminating Company is doing a survey on the relationship between electricity used in kilowatt-hours (thousand) and the number of rooms in a private single-family residence. A random sample of 10 homes was selected and the electricity consumption recorded as below. ii. Find a suitable linear regression equation ? = ? + ??. iii. Determine the number of kilowatt-hours (thousand) for an eleven-room residence.arrow_forwardProblem 1: I have uploaded data (PCE-PDI.xls) for the US total personal consumption expenditures and total disposable income from 1971:1 to 2009:7. Divide the entire sample into two subsamples: 1971:01 to 1985:12 and 1986:01 to 2009:07. Here consumption expenditure (PCE) is the dependent variable and disposable income (PDI) is the independent variable. Let variable Y denotes consumption expenditure and variable X denotes disposable income. (a) Estimate a two-variable regression model for both subsamples and report the estimated results.arrow_forward
- The operations manager of a musical instrument distributor feels that the demand for Bass Drums may be related to the number of television appearances by the popular rick group Green Shades during the previous month. The manager has collected the data shown in the following table. Demand for Bass Drums 3 6 7 5 10 8 Green Shades TV appearances 3 4 7 6 8 5 Develop the linear regression equation to forecast. Forecast demand for Bass Drums when Green Shades’ TV appearances are 10. Compute MSE and standard deviation for Problem 8.arrow_forwardProblem B30 students were given a two-hour exam and their scores were determined. After the exam, the students were subjected to a 30-minute physical exercise and then took another two-hour exam. 1. Identify the variables and their data types. Indicate whether independent or dependent.2. Identify the t-test to be used.arrow_forwardQuestion 3. Calculate and interpret the regression line for the data.arrow_forward
- Do students with higher college grade point averages (GPAs) earn more than those graduates with lower GPAs?† Consider the following hypothetical college GPA and salary data (10 years after graduation). GPA Salary ($) 2.22 72,000 2.27 48,000 2.57 72,000 2.59 62,000 2.77 86,000 2.85 96,000 3.12 133,000 3.35 130,000 3.66 157,000 3.68 162,000 #1) Use these data to develop an estimated regression equation that can be used to predict annual salary 10 years after graduation given college GPA. (Let x = GPA, and let y = salary (in $). Round your numerical values to the nearest integer.) ŷ = #2) Find the value of the test statistic. (Round your answer to two decimal places.) #3)Find the p-value. (Round your answer to three decimal places.) p-value =arrow_forwardSuppose you are to design an experiment for the following problems, identify the independent variable(IV), dependent variable (DV), two to three constant factors and the possible control (NEGATIVE OR POSITIVE) to be used in the experiment. 4. What is the effect of the amount of time spent on social media on a person’s anxiety level?Problem: ________________________________________________a. IV ________________________________________________b. DV _______________________________________________c. Constant __________________________________________d. Control Group ______________________________________ 5. Do rice plants grow faster in saline water compared to pure water? Problem: ________________________________________________a. IV ________________________________________________b. DV _______________________________________________c. Constant __________________________________________d. Control Group ______________________________________ Example: 1. Does the type of glue affects…arrow_forwardIf the equation of the regression line that relates hours per week spent in the tutor lab, x, to GPA, y, is y=2.1+0.28, then the best presdiction for the GPA of students who never go into the lab would be 2.1 True Or Falsearrow_forward
- Questions 1-30 refer to the following scenario: A company reports bi-annual (twice a year) sales data. The sales data for the last three years is shown in below Table. Why would it be a bad idea to use the linear regression line to make forecasts when looking at the data? a The linear trend line does not capture the fact that, on average, sales go up. b The linear trend line does not capture the seasonality of the data. c Both a. and b. are correct. d None of the above. Decomposition forecasting decomposes data into which two factors? a Slope and intercept b Trend and seasonality c Past and future data d Decom and position In decomposition forecasting, the calculated seasonal index for the first bi-annual period is a 0.71 b 1.29 c 0.89 d 1.41 In decomposition forecasting, the calculated seasonal index for the second bi-annual period is a 0.89 b 0.71 c 1.41 d 1.29 Using only the regression line, the…arrow_forward2.1 Sales personnel want to further develop the model to include other variables. Merchandise Sales ($10,000s) Tickets Sold (1000s) Win or Loss (W or L) Event includes fan giveaway (Y or N) 15 54 W N 17 67 L Y 10 53 L Y 9 49 W Y 16 59 W N 14 58 L Y 12 56 W N 19 63 W Y 18 65 L Y 17 61 L Y Should you keep either or both of the variables in the model and why? What is the regression equation (only include variables that should be in the model)? What is the merchandise sales forecast for 58,000 tickets sold at a winning event that does not include a fan giveaway?arrow_forwardIn general, ___________% of the values in a data set lie at or below the 28 th percentile. _______________ % of the values in a data set lie at or above the 90 th percentile.. If a sample consists of 700 test scores, _________of them would be at or below the 52 th percentile. If a sample consists of 700 test scores, ________ of them would be at or above the 64 th percentile.arrow_forward
arrow_back_ios
arrow_forward_ios
Recommended textbooks for you
 MATLAB: An Introduction with ApplicationsStatisticsISBN:9781119256830Author:Amos GilatPublisher:John Wiley & Sons Inc
 Probability and Statistics for Engineering and th...StatisticsISBN:9781305251809Author:Jay L. DevorePublisher:Cengage Learning
 Statistics for The Behavioral Sciences (MindTap C...StatisticsISBN:9781305504912Author:Frederick J Gravetter, Larry B. WallnauPublisher:Cengage Learning
 Elementary Statistics: Picturing the World (7th E...StatisticsISBN:9780134683416Author:Ron Larson, Betsy FarberPublisher:PEARSON
 The Basic Practice of StatisticsStatisticsISBN:9781319042578Author:David S. Moore, William I. Notz, Michael A. FlignerPublisher:W. H. Freeman
 Introduction to the Practice of StatisticsStatisticsISBN:9781319013387Author:David S. Moore, George P. McCabe, Bruce A. CraigPublisher:W. H. Freeman
MATLAB: An Introduction with Applications
Statistics
ISBN:9781119256830
Author:Amos Gilat
Publisher:John Wiley & Sons Inc
Probability and Statistics for Engineering and th...
Statistics
ISBN:9781305251809
Author:Jay L. Devore
Publisher:Cengage Learning
Statistics for The Behavioral Sciences (MindTap C...
Statistics
ISBN:9781305504912
Author:Frederick J Gravetter, Larry B. Wallnau
Publisher:Cengage Learning
Elementary Statistics: Picturing the World (7th E...
Statistics
ISBN:9780134683416
Author:Ron Larson, Betsy Farber
Publisher:PEARSON
The Basic Practice of Statistics
Statistics
ISBN:9781319042578
Author:David S. Moore, William I. Notz, Michael A. Fligner
Publisher:W. H. Freeman
Introduction to the Practice of Statistics
Statistics
ISBN:9781319013387
Author:David S. Moore, George P. McCabe, Bruce A. Craig
Publisher:W. H. Freeman
Correlation Vs Regression: Difference Between them with definition & Comparison Chart; Author: Key Differences;https://www.youtube.com/watch?v=Ou2QGSJVd0U;License: Standard YouTube License, CC-BY
Correlation and Regression: Concepts with Illustrative examples; Author: LEARN & APPLY : Lean and Six Sigma;https://www.youtube.com/watch?v=xTpHD5WLuoA;License: Standard YouTube License, CC-BY