
Introductory Statistics (10th Edition)
10th Edition
ISBN: 9780321989178
Author: Neil A. Weiss
Publisher: PEARSON
expand_more
expand_more
format_list_bulleted
Concept explainers
Videos
Textbook Question
Chapter B.1, Problem 32E
Drosophila Life-span. In the paper “Extended Life-Span and Stress Resistance in the Drosophila Mutant Methuselah,” Y. Lin, L. Scroude, and S. Benzer studied the life-span of the methuselah strain of Drosophila fruit fly, which had been bred for increased lifespan and resistance to stress (Science, 282, pp, 943–9461, The data in the following table, read from a graph, gives the results of observing the mortality rate (fraction of flies dying per day) of 783 male methuselah flies over their life spans. Mortality rate was determined every three or four days.
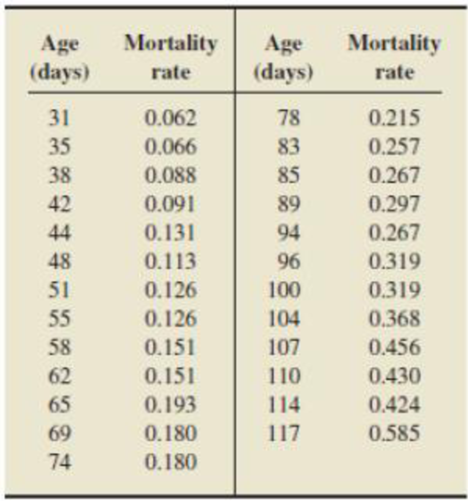
Use Procedure B.1 on page B-13 to obtain a suitable regression equation for predicting mortality rate based on age.
Expert Solution & Answer
Want to see the full answer?
Check out a sample textbook solution
Students have asked these similar questions
Blood cocaine concentration (mg/L) was determinedboth for a sample of individuals who had died fromcocaine-induced excited delirium (ED) and for a sampleof those who had died from a cocaine overdose withoutexcited delirium; survival time for people in bothgroups was at most 6 hours. The accompanying datawas read from a comparative boxplot in the article“Fatal Excited Delirium Following Cocaine Use” (J.of Forensic Sciences, 1997: 25–31).
ED 0 0 0 0 .1 .1 .1 .1 .2 .2 .3 .3.3 .4 .5 .7 .8 1.0 1.5 2.7 2.83.5 4.0 8.9 9.2 11.7 21.0Non-ED 0 0 0 0 0 .1 .1 .1 .1 .2 .2 .2.3 .3 .3 .4 .5 .5 .6 .8 .9 1.01.2 1.4 1.5 1.7 2.0 3.2 3.5 4.14.3 4.8 5.0 5.6 5.9 6.0 6.4 7.98.3 8.7 9.1 9.6 9.9 11.0 11.512.2 12.7 14.0 16.6 17.8
a. Determine the medians, fourths, and fourth spreadsfor the two samples.b. Are there any outliers in either sample? Any extremeoutliers?c. Construct a comparative boxplot, and use it as abasis for comparing and contrasting the ED andnon-ED samples.
Medical researchers have noted that adolescent females are much more likely to deliver lowbirth-weight babies than adult females. Because low-birth-weight babies have higher mortalityrates, a number of studies have examined the relationship between birth weight and mother’sage for babies born to young mothers. One such study is described in the article “Body Size andIntelligence in 6-Year-Olds: Are Offspring of Teenage Mothers at Risk?” (Maternal and Child Health Journal [2009]: 847-856). The following data in Table 2 consists of two variables; x is thematernal age (in years) and y is birth weight of baby (in kilograms) are consistent with summaryvalues given in the referenced article and also with data published by the National Center forHealth Statistics.
1
2
3
4
5
6
7
8
9
10
x
15
17
18
15
16
19
17
16
18
19
y
2.29
3.39
3.27
2.64
2.89
3.32
2.97
2.53
3.13
3.57
(i) Find the equation of estimated regression line(ii) Predict the birth weight of a baby to be born to a…
Leisure Activities and Dementia. An article appearing in the Los Angeles Times discussed the study “Leisure Activities and the Risk of Dementia in the Elderly” (New England Journal of Medicine, Vol. 348) by J.Verghese et al. The article in the Times, titled “Crosswords Reduce Risk of Dementia,” contained the following statement: “Elderly people who frequently read, do crossword puzzles, practice a musical instrument or play board games cut their risk of Alzheimer’s and other forms of dementia by nearly two-thirds compared with people who seldom do such activities.” Comment on thestatement in quotes, keeping in mind the type of study for which causation can be reasonably inferred.
Chapter B Solutions
Introductory Statistics (10th Edition)
Ch. B.1 - Regarding the regression of a response variable,...Ch. B.1 - Fill in the blanks. a. The assumption that all...Ch. B.1 - Answer true or false to each of the following...Ch. B.1 - Prob. 4ECh. B.1 - In each of Exercises B.5B.14, a. decide whether...Ch. B.1 - Prob. 6ECh. B.1 - Prob. 7ECh. B.1 - In each of Exercises B.5B.14, a. decide whether...Ch. B.1 - In each of Exercises B.5B.14, a. decide whether...Ch. B.1 - In each of Exercises B.5B.14, a. decide whether...
Ch. B.1 - In each of Exercises B.5B.14, a. decide whether...Ch. B.1 - Prob. 12ECh. B.1 - In each of Exercises B.5B.14, a. decide whether...Ch. B.1 - In each of Exercises B.5B.14, a. decide whether...Ch. B.1 - Consider the scatterplot of y versus x in Output...Ch. B.1 - Consider the scatterplot of y versus x in Output...Ch. B.1 - Prob. 17ECh. B.1 - Prob. 18ECh. B.1 - If one or both of the assumptions of...Ch. B.1 - Prob. 20ECh. B.1 - Prob. 21ECh. B.1 - Prob. 22ECh. B.1 - Prob. 23ECh. B.1 - Gasoline Mileage Ratings. Gasoline mileage and...Ch. B.1 - Hip Fracture Rates. In the paper Very Low Rates of...Ch. B.1 - Prob. 26ECh. B.1 - Prob. 27ECh. B.1 - Prob. 28ECh. B.1 - Prob. 29ECh. B.1 - Gasoline Mileage Ratings. Refer to Exercise B.24,...Ch. B.1 - Hip Fracture Rates. Refer to Exercise B.25, where...Ch. B.1 - Drosophila Life-span. In the paper Extended...Ch. B.1 - Protein Content of Wheat. In their text, Methods...Ch. B.1 - Pine Tree Volume. Table B.2 on page B-5 provides...Ch. B.2 - Give an example of a. a second-degree polynomial...Ch. B.2 - In the polynomial regression equation y = 8 + 3x ...Ch. B.2 - Answer true or false to each of the following...Ch. B.2 - Explain why it is difficult to interpret the...Ch. B.2 - Fill in the blanks. a. A predictor variable is...Ch. B.2 - Answer true or false to each of the following...Ch. B.2 - Refer to the scatterplots in Outputs B.32(a) and...Ch. B.2 - Fill in the blanks. a. In the _______ method for...Ch. B.2 - Answer true or false to each of the following...Ch. B.2 - Stopping Distance. In their text Methods of...Ch. B.2 - Hour of Birth. In the paper increased Frequency of...Ch. B.2 - Silica Gel. Silica gel is a substance that absorbs...Ch. B.2 - Note: The data for the Using Technology exercises...Ch. B.2 - Hour of Birth. Refer to Exercise B.45, where the...Ch. B.2 - Silica Gel. Refer to Exercise B.46, where the...Ch. B.2 - Gasoline Mileage Ratings. Refer to Exercise B.24...Ch. B.2 - Protein Content of Wheat. Refer to Exercise B.33...Ch. B.2 - Satellite Orbits. Each issue of the magazine Ad...Ch. B.2 - Pine Tree Volume. In Example B.6 on page B-4, we...Ch. B.3 - Explain the difference between a quantitative...Ch. B.3 - In predicting a person's income, identify two...Ch. B.3 - In predicting the change in blood pressure for...Ch. B.3 - Fill in the blanks. a. A ___ predictor variable is...Ch. B.3 - Prob. 59ECh. B.3 - Answer true or false to each of the following...Ch. B.3 - For the regression equation y = 15 + 2x1 + 4x2 ...Ch. B.3 - Refer to Exercise B.61: a. Do the slopes of the...Ch. B.3 - Consider the regression equation y = 0 + 1 x1+ 2x2...Ch. B.3 - Prob. 64ECh. B.3 - Prob. 65ECh. B.3 - Prob. 66ECh. B.3 - Home Sale Prices. Refer to Example B.18 on page...Ch. B.3 - Mental Tasks and Drugs. In the text Statistical...Ch. B.3 - Gasoline Mileage Ratings. Refer to Exercise B.66...Ch. B.3 - Home Sale Prices. Refer to Exercise B.67 regarding...Ch. B.3 - Mental Tasks and Drugs. Refer to Exercise B.68...Ch. B.3 - Hip Fracture Rates. Refer to Exercise B.25 on page...Ch. B.3 - Television Viewing. The results of a study on...Ch. B.3 - Glue Strength. In the text Quality Control and...Ch. B.4 - Explain why the interpretation of the regression...Ch. B.4 - Answer true or false to each of the following...Ch. B.4 - Explain what is meant by multicollinearity.Ch. B.4 - Fill in the blanks. a. Consider a regression model...Ch. B.4 - Prob. 79ECh. B.4 - Prob. 80ECh. B.4 - Fill in the blanks. a. If predictor variable x1...Ch. B.4 - Answer true or false to each of the following...Ch. B.4 - State four ways to detect the presence of...Ch. B.4 - Prob. 84ECh. B.4 - Prob. 85ECh. B.4 - Prob. 86ECh. B.4 - Prob. 87ECh. B.4 - Prob. 88ECh. B.4 - Graduation Rates. Refer to Exercise B.86, where we...Ch. B.4 - Prob. 90ECh. B.4 - Gasoline Mileage Ratings. Refer to Exercise B.84,...Ch. B.4 - Graduation Rules. Refer to Exercise B.86, where we...Ch. B.5 - Explain what is meant by the variable selection...Ch. B.5 - Prob. 94ECh. B.5 - Fill in the blanks. a. In the forward selection...Ch. B.5 - Prob. 96ECh. B.5 - Answer true or false to each of the following...Ch. B.5 - Prob. 98ECh. B.5 - Prob. 99ECh. B.5 - Prob. 100ECh. B.5 - Prob. 101ECh. B.5 - Suppose that x1, x2, x3, and x4 are predictor...Ch. B.5 - Prob. 103ECh. B.5 - Graduation Rates. Refer to Exercise B.92 on page...Ch. B.5 - Home Sale Prices. In Example B. 18 on page B-67,...Ch. B.5 - Home Sale Prices. In Example B.18 on page B-67, we...Ch. B.5 - Infant Mortality Rates. In the article Children's...Ch. B.6 - Consider a multiple linear regression relating the...Ch. B.6 - Prob. 109ECh. B.6 - Prob. 110ECh. B.6 - Answer true or false to each of the following...Ch. B.6 - Explain the similarities and differences between...Ch. B.6 - Fill in the blanks. a. In the Mallows Cp...Ch. B.6 - Answer true or false to each of the following...Ch. B.6 - Gasoline Mileage Ratings. Refer to Exercise B.84...Ch. B.6 - Advertising and Sales. Refer to Exercise B.85 on...Ch. B.6 - Graduation Rates. Refer to Exercise B.86 on page...Ch. B.6 - Suppose that x1, x2, x3, and x4 are predictor...Ch. B.6 - Suppose that x1 x2, x3, and x4 are predictor...Ch. B.6 - Gasoline Mileage Ratings. Refer to Exercise B.91...Ch. B.6 - Graduation Rates. Refer to Exercise B.92 on page...Ch. B.6 - Home Sale Prices. Refer to Exercise B.105 on page...Ch. B.6 - Body Fat. Refer to Exercise B.106 on page B-143,...Ch. B.6 - Infant Mortality Rates. Refer to Exercise B.107 on...Ch. B.7 - List six problems that can arise in the collection...Ch. B.7 - Prob. 126ECh. B.7 - Prob. 127ECh. B.7 - Give an example of how a nonrepresentative sample...Ch. B.7 - Discuss the effect on a regression analysis of not...Ch. B.7 - Explain how multicollinearity can adversely affect...Ch. B.7 - Briefly describe what is meant by the problem of...Ch. B.7 - Answer true or false to each of the following...Ch. B.7 - Prob. 133ECh. B.7 - Discuss the advantages of using data collected...Ch. B.7 - Describe the potential effects of outliers on...Ch. B.7 - Prob. 136ECh. B.7 - Regarding regression analysis: a. What assumptions...Ch. B.7 - Answer true or false to each of the following...Ch. B.7 - Answer true or false to each of the following...Ch. B.7 - Discuss what G. E. P. Box might have meant when he...Ch. B.7 - Regarding model validation in regression: a. What...Ch. B - Explain what is meant when we say that a nonlinear...Ch. B - Answer true or false to the following statements...Ch. B - Prob. 3RPCh. B - Prob. 4RPCh. B - Answer true or false to each of the following...Ch. B - Paper Strength. In their text, Introduction to...Ch. B - Answer true or false to each of the following...Ch. B - Prob. 8RPCh. B - Explain what is meant when we say that a...Ch. B - OUTPUT B.95 Output for Problem 10 Regression...Ch. B - In regressing a response variable on several...Ch. B - Answer true or false to each of the following...Ch. B - Fill in the blanks. a. Multicollinearity is...Ch. B - Prob. 14RPCh. B - Explain why selecting a regression equation using...Ch. B - Answer true or false to each of the following...Ch. B - Fill in the blanks. a. In the _____ method, we...Ch. B - Patent Production. In the report The State New...Ch. B - Prob. 19RPCh. B - Prob. 20RPCh. B - Patent Production. Refer to Problem 18. where we...Ch. B - Prob. 22RPCh. B - Prob. 23RPCh. B - What are the possible consequences of the presence...Ch. B - Windmill Output. Refer to Problem 3, where we...Ch. B - Paper Strength. Refer to Problem 6, where we...Ch. B - Diabetes. Refer to Problem 10, where we considered...Ch. B - Hospital Stalling. Refer to Problem 14, where we...Ch. B - Patent Production. Refer to Problem 18, where we...Ch. B - Patent Production. Refer to Problem 29, where we...Ch. B - Recall from Chapter 1 of your text that the Focus...Ch. B - At the beginning of this module on page B-l, we...
Knowledge Booster


Learn more about
Need a deep-dive on the concept behind this application? Look no further. Learn more about this topic, statistics and related others by exploring similar questions and additional content below.Similar questions
- Urban Travel Times Population of cities and driving times are related, as shown in the accompanying table, which shows the 1960 population N, in thousands, for several cities, together with the average time T, in minutes, sent by residents driving to work. City Population N Driving time T Los Angeles 6489 16.8 Pittsburgh 1804 12.6 Washington 1808 14.3 Hutchinson 38 6.1 Nashville 347 10.8 Tallahassee 48 7.3 An analysis of these data, along with data from 17 other cities in the United States and Canada, led to a power model of average driving time as a function of population. a Construct a power model of driving time in minutes as a function of population measured in thousands b Is average driving time in Pittsburgh more or less than would be expected from its population? c If you wish to move to a smaller city to reduce your average driving time to work by 25, how much smaller should the city be?arrow_forwardIn a study conducted in the Science Department of Faculty of Science, Technology and Human Development in a University; the researcher examined the influence of the drug succinylcholine on the circulation levels of androgens in the blood. Blood samples from wild, free-ranging deer were obtained via the jugular vein immediately after an intramuscular injection of succinylcholine using darts and a capture gun. Deer were bled again approximately 30 minutes after the injection and then released. The level of androgens at time of capture and 30 minutes later, measured in nanograms per milliliter (ng/ml), for 15 deers as in Table Q1. Assuming that the populations of androgen at time of injection and 30 minutes later are normally distributed:i) Find the average and standard deviation of this studyii)Determine the critical region of this problem.iii) Test at the 0.05 level of significance whether the androgen concentrations are altered after 30 minutes of restraint.arrow_forwardA research was conducted which revealed that the students’ usage of mobile phones has nowadays increased after the pandemic due to online classes and submission of their assignments and quizzes. Already the usage of mobile phones for the students was growing due to social media and different online games. The data of 25 students is provided to you in Table 2.1 that displays hours (time) spend by the children on mobile phones per week. Table 2.1 67 64 59 66 59 68 64 61 65 67 67 67 63 59 65 69 62 70 70 60 59 65 66 69 67 You are required to Compute the Frequency Distribution, Cumulative Frequency and Cumulative Relative Frequency. Sketch Histogram in Excel. Define the skewness of the drawn Histogram.arrow_forward
- Low-Birth-Weight Hospital Stays. Data on low-birthweight babies were collected over a 2-year period by 14 participating centers of the National Institute of Child Health and Human Development Neonatal Research Network. Results were reported by J. Lemons et al. in the on-line paper “Very Low Birth Weight Outcomes of the National Institute of ChildHealth and Human Development Neonatal Research Network” (Pediatrics, Vol. 107, No. 1, p. e1). For the 1084 surviving babies whose birth weights were 751– 1000 grams, the average length of stay in the hospital was 86 days, although one center had an average of 66 days and another had an average of 108 days. a. Can the mean lengths of stay be considered population means? Explain your answer.b. Assuming that the population standard deviation is 12 days, determine the z-score for a baby’s length of stay of 86 days at the center where the mean was 66 days.c. Assuming that the population standard deviation is 12 days, determine the z-score for a…arrow_forwardThe data in the attached image represents blood pressure based on a new trial medication used in an experiment involving a total of 50 male and female subjects. There were two levels of treatment: 0 = placebo and 1 = treatment group. Family History Blood Pressure = Fam-Hist-BP; from the paternal side = PS; from the maternal side = MS; from both sides = BS; none on both sides or not known = N.; Blood pressure before the experiment = BP-Before-Exp; Blood pressure after the experiment = BP-After-Exp. Task: Construct a scatterplot to display the relationship and find the correlation between age and BP-Before Exp.arrow_forwardThe data in the attached image represents blood pressure based on a new trial medication used in an experiment involving a total of 50 male and female subjects. There were two levels of treatment: 0 = placebo and 1 = treatment group. Family History Blood Pressure = Fam-Hist-BP; from the paternal side = PS; from the maternal side = MS; from both sides = BS; none on both sides or not known = N.; Blood pressure before the experiment = BP-Before-Exp; Blood pressure after the experiment = BP-After-Exp. Task: Construct a histogram to represent the family BP history, the subjects' BP before treatment and the subjects' BP after treatment.arrow_forward
arrow_back_ios
arrow_forward_ios
Recommended textbooks for you
 Functions and Change: A Modeling Approach to Coll...AlgebraISBN:9781337111348Author:Bruce Crauder, Benny Evans, Alan NoellPublisher:Cengage Learning
 Linear Algebra: A Modern IntroductionAlgebraISBN:9781285463247Author:David PoolePublisher:Cengage Learning
 Holt Mcdougal Larson Pre-algebra: Student Edition...AlgebraISBN:9780547587776Author:HOLT MCDOUGALPublisher:HOLT MCDOUGAL
 Big Ideas Math A Bridge To Success Algebra 1: Stu...AlgebraISBN:9781680331141Author:HOUGHTON MIFFLIN HARCOURTPublisher:Houghton Mifflin Harcourt
Functions and Change: A Modeling Approach to Coll...
Algebra
ISBN:9781337111348
Author:Bruce Crauder, Benny Evans, Alan Noell
Publisher:Cengage Learning
Linear Algebra: A Modern Introduction
Algebra
ISBN:9781285463247
Author:David Poole
Publisher:Cengage Learning
Holt Mcdougal Larson Pre-algebra: Student Edition...
Algebra
ISBN:9780547587776
Author:HOLT MCDOUGAL
Publisher:HOLT MCDOUGAL
Big Ideas Math A Bridge To Success Algebra 1: Stu...
Algebra
ISBN:9781680331141
Author:HOUGHTON MIFFLIN HARCOURT
Publisher:Houghton Mifflin Harcourt
Hypothesis Testing - Solving Problems With Proportions; Author: The Organic Chemistry Tutor;https://www.youtube.com/watch?v=76VruarGn2Q;License: Standard YouTube License, CC-BY
Hypothesis Testing and Confidence Intervals (FRM Part 1 – Book 2 – Chapter 5); Author: Analystprep;https://www.youtube.com/watch?v=vth3yZIUlGQ;License: Standard YouTube License, CC-BY