
Introductory Statistics (10th Edition)
10th Edition
ISBN: 9780321989178
Author: Neil A. Weiss
Publisher: PEARSON
expand_more
expand_more
format_list_bulleted
Concept explainers
Videos
Textbook Question
Chapter B.2, Problem 54E
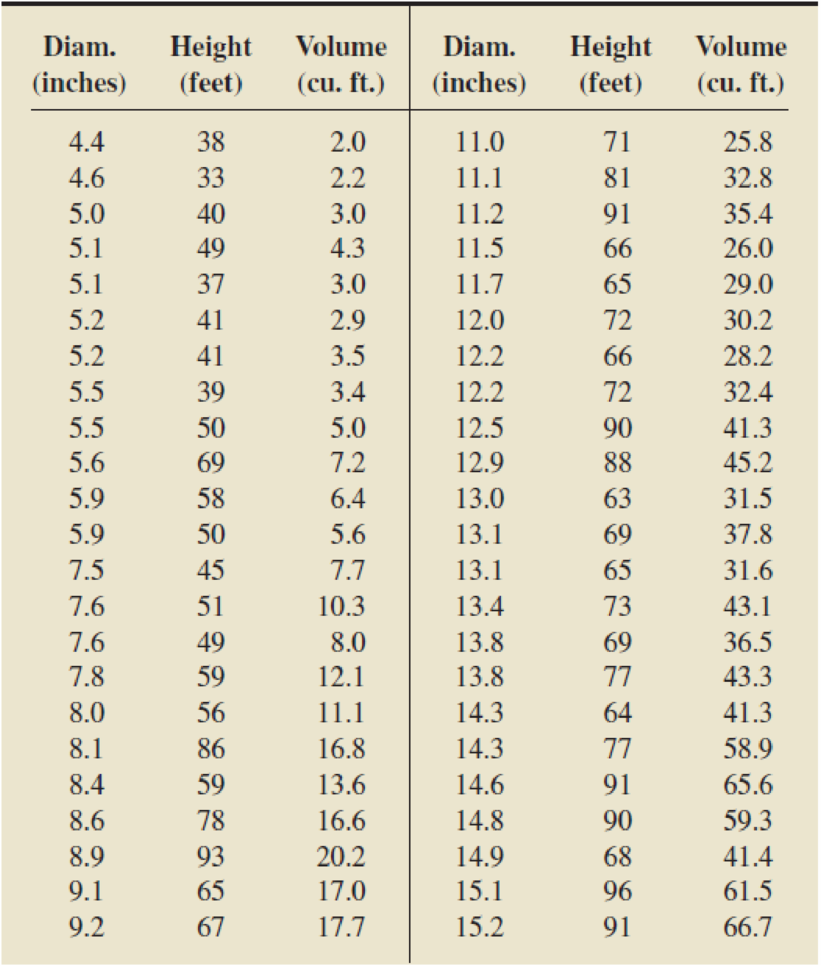
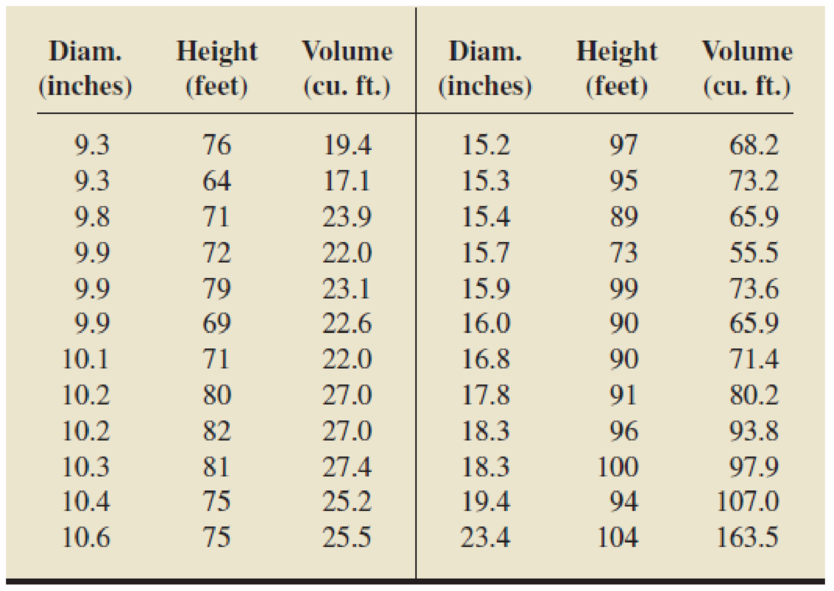
Pine Tree Volume. In Example B.6 on page B-4, we provided data on volume and diameter for 70 shortleaf pine trees and used the method of transformations in an attempt to predict volume based on diameter. In this exercise, we include the observed heights of the 70 pine trees and propose using a second-order polynomial regression equation in diameter and height to predict volume. The data are given in the following table.
- a. Obtain a
scatterplot matrix for the observed values of volume, diameter, and height. What do these plots indicate about the relationship between volume and diameter? between volume and height? - b. Obtain a three-dimensional scatterplot of volume versus diameter and height. What does this plot indicate about the relationship between volume and the two predictor variables diameter and height?.
- c. Obtain the
correlation coefficients between volume and the first- and second-order terms in the centered predictor variables diameterc and heightc. Which terms are most highly correlated with volume? What are the correlation coefficients between the first- and second-order terms? Will thesecorrelations adversely affect the ability to assess the effect of a term in the presence of the other terms? Explain your answer. - d. Perform a second-order polynomial
regression analysis for volume using the centered predictor variables diameterc and heightc. Based on the t-tests for the utility of each term in the model, which terms would you retain in the regression equation? Is it appropriate to use the t-tests here? - e. Obtain plots of residuals versus fitted values, residuals versus diameterc, and residuals versus heightc, and also a normal probability plot of the residuals. Assess the appropriateness of the second-order polynomial regression equation, the assumption of constant conditional standard deviations, and the assumption of normality of the conditional distributions. Check for outliers and influential observations.
- f. Does your analysis in part (e) reveal any violations of the assumptions for regression inferences? Explain.
- g. To address the problems found in part (f), what would you suggest as the next step in the analysis?
- h. Referring to part (g), carry out your suggestion in an attempt to obtain a model that meets the assumptions for regression inferences.
Expert Solution & Answer
Want to see the full answer?
Check out a sample textbook solution
Students have asked these similar questions
Question 9 of 10, Step 1 of 2
The following table lists the birth weights (in pounds), x, and the lengths (in inches), y, for a set of newborn babies at a local hospital. Birth Weights and Lengths
Birth Weight (in Pounds), x
8
7
6
9
10
8
3
3
7
11
Length (in Inches), y
20
18
16
21
19
20
15
16
16
21
Step 1 of 2 :
Find an equation of the least-squares regression line. Round your answer to three decimal places, if necessary.
Given the following table, use the matrix method to derive the constant and slope parametersof the sample regression function: Module test mark = f (Weekly study hours). X and Y standfor weekly study hours and module test mark respectively.
X (Weekly study hours)
Y (Module test mark)
1
40
2
40
3
45
4
60
5
70
6
75
2.state each of the five assumptions of the classical regression model (OLS) and give an intuitive explanation of the meaning and need for each of them
Chapter B Solutions
Introductory Statistics (10th Edition)
Ch. B.1 - Regarding the regression of a response variable,...Ch. B.1 - Fill in the blanks. a. The assumption that all...Ch. B.1 - Answer true or false to each of the following...Ch. B.1 - Prob. 4ECh. B.1 - In each of Exercises B.5B.14, a. decide whether...Ch. B.1 - Prob. 6ECh. B.1 - Prob. 7ECh. B.1 - In each of Exercises B.5B.14, a. decide whether...Ch. B.1 - In each of Exercises B.5B.14, a. decide whether...Ch. B.1 - In each of Exercises B.5B.14, a. decide whether...
Ch. B.1 - In each of Exercises B.5B.14, a. decide whether...Ch. B.1 - Prob. 12ECh. B.1 - In each of Exercises B.5B.14, a. decide whether...Ch. B.1 - In each of Exercises B.5B.14, a. decide whether...Ch. B.1 - Consider the scatterplot of y versus x in Output...Ch. B.1 - Consider the scatterplot of y versus x in Output...Ch. B.1 - Prob. 17ECh. B.1 - Prob. 18ECh. B.1 - If one or both of the assumptions of...Ch. B.1 - Prob. 20ECh. B.1 - Prob. 21ECh. B.1 - Prob. 22ECh. B.1 - Prob. 23ECh. B.1 - Gasoline Mileage Ratings. Gasoline mileage and...Ch. B.1 - Hip Fracture Rates. In the paper Very Low Rates of...Ch. B.1 - Prob. 26ECh. B.1 - Prob. 27ECh. B.1 - Prob. 28ECh. B.1 - Prob. 29ECh. B.1 - Gasoline Mileage Ratings. Refer to Exercise B.24,...Ch. B.1 - Hip Fracture Rates. Refer to Exercise B.25, where...Ch. B.1 - Drosophila Life-span. In the paper Extended...Ch. B.1 - Protein Content of Wheat. In their text, Methods...Ch. B.1 - Pine Tree Volume. Table B.2 on page B-5 provides...Ch. B.2 - Give an example of a. a second-degree polynomial...Ch. B.2 - In the polynomial regression equation y = 8 + 3x ...Ch. B.2 - Answer true or false to each of the following...Ch. B.2 - Explain why it is difficult to interpret the...Ch. B.2 - Fill in the blanks. a. A predictor variable is...Ch. B.2 - Answer true or false to each of the following...Ch. B.2 - Refer to the scatterplots in Outputs B.32(a) and...Ch. B.2 - Fill in the blanks. a. In the _______ method for...Ch. B.2 - Answer true or false to each of the following...Ch. B.2 - Stopping Distance. In their text Methods of...Ch. B.2 - Hour of Birth. In the paper increased Frequency of...Ch. B.2 - Silica Gel. Silica gel is a substance that absorbs...Ch. B.2 - Note: The data for the Using Technology exercises...Ch. B.2 - Hour of Birth. Refer to Exercise B.45, where the...Ch. B.2 - Silica Gel. Refer to Exercise B.46, where the...Ch. B.2 - Gasoline Mileage Ratings. Refer to Exercise B.24...Ch. B.2 - Protein Content of Wheat. Refer to Exercise B.33...Ch. B.2 - Satellite Orbits. Each issue of the magazine Ad...Ch. B.2 - Pine Tree Volume. In Example B.6 on page B-4, we...Ch. B.3 - Explain the difference between a quantitative...Ch. B.3 - In predicting a person's income, identify two...Ch. B.3 - In predicting the change in blood pressure for...Ch. B.3 - Fill in the blanks. a. A ___ predictor variable is...Ch. B.3 - Prob. 59ECh. B.3 - Answer true or false to each of the following...Ch. B.3 - For the regression equation y = 15 + 2x1 + 4x2 ...Ch. B.3 - Refer to Exercise B.61: a. Do the slopes of the...Ch. B.3 - Consider the regression equation y = 0 + 1 x1+ 2x2...Ch. B.3 - Prob. 64ECh. B.3 - Prob. 65ECh. B.3 - Prob. 66ECh. B.3 - Home Sale Prices. Refer to Example B.18 on page...Ch. B.3 - Mental Tasks and Drugs. In the text Statistical...Ch. B.3 - Gasoline Mileage Ratings. Refer to Exercise B.66...Ch. B.3 - Home Sale Prices. Refer to Exercise B.67 regarding...Ch. B.3 - Mental Tasks and Drugs. Refer to Exercise B.68...Ch. B.3 - Hip Fracture Rates. Refer to Exercise B.25 on page...Ch. B.3 - Television Viewing. The results of a study on...Ch. B.3 - Glue Strength. In the text Quality Control and...Ch. B.4 - Explain why the interpretation of the regression...Ch. B.4 - Answer true or false to each of the following...Ch. B.4 - Explain what is meant by multicollinearity.Ch. B.4 - Fill in the blanks. a. Consider a regression model...Ch. B.4 - Prob. 79ECh. B.4 - Prob. 80ECh. B.4 - Fill in the blanks. a. If predictor variable x1...Ch. B.4 - Answer true or false to each of the following...Ch. B.4 - State four ways to detect the presence of...Ch. B.4 - Prob. 84ECh. B.4 - Prob. 85ECh. B.4 - Prob. 86ECh. B.4 - Prob. 87ECh. B.4 - Prob. 88ECh. B.4 - Graduation Rates. Refer to Exercise B.86, where we...Ch. B.4 - Prob. 90ECh. B.4 - Gasoline Mileage Ratings. Refer to Exercise B.84,...Ch. B.4 - Graduation Rules. Refer to Exercise B.86, where we...Ch. B.5 - Explain what is meant by the variable selection...Ch. B.5 - Prob. 94ECh. B.5 - Fill in the blanks. a. In the forward selection...Ch. B.5 - Prob. 96ECh. B.5 - Answer true or false to each of the following...Ch. B.5 - Prob. 98ECh. B.5 - Prob. 99ECh. B.5 - Prob. 100ECh. B.5 - Prob. 101ECh. B.5 - Suppose that x1, x2, x3, and x4 are predictor...Ch. B.5 - Prob. 103ECh. B.5 - Graduation Rates. Refer to Exercise B.92 on page...Ch. B.5 - Home Sale Prices. In Example B. 18 on page B-67,...Ch. B.5 - Home Sale Prices. In Example B.18 on page B-67, we...Ch. B.5 - Infant Mortality Rates. In the article Children's...Ch. B.6 - Consider a multiple linear regression relating the...Ch. B.6 - Prob. 109ECh. B.6 - Prob. 110ECh. B.6 - Answer true or false to each of the following...Ch. B.6 - Explain the similarities and differences between...Ch. B.6 - Fill in the blanks. a. In the Mallows Cp...Ch. B.6 - Answer true or false to each of the following...Ch. B.6 - Gasoline Mileage Ratings. Refer to Exercise B.84...Ch. B.6 - Advertising and Sales. Refer to Exercise B.85 on...Ch. B.6 - Graduation Rates. Refer to Exercise B.86 on page...Ch. B.6 - Suppose that x1, x2, x3, and x4 are predictor...Ch. B.6 - Suppose that x1 x2, x3, and x4 are predictor...Ch. B.6 - Gasoline Mileage Ratings. Refer to Exercise B.91...Ch. B.6 - Graduation Rates. Refer to Exercise B.92 on page...Ch. B.6 - Home Sale Prices. Refer to Exercise B.105 on page...Ch. B.6 - Body Fat. Refer to Exercise B.106 on page B-143,...Ch. B.6 - Infant Mortality Rates. Refer to Exercise B.107 on...Ch. B.7 - List six problems that can arise in the collection...Ch. B.7 - Prob. 126ECh. B.7 - Prob. 127ECh. B.7 - Give an example of how a nonrepresentative sample...Ch. B.7 - Discuss the effect on a regression analysis of not...Ch. B.7 - Explain how multicollinearity can adversely affect...Ch. B.7 - Briefly describe what is meant by the problem of...Ch. B.7 - Answer true or false to each of the following...Ch. B.7 - Prob. 133ECh. B.7 - Discuss the advantages of using data collected...Ch. B.7 - Describe the potential effects of outliers on...Ch. B.7 - Prob. 136ECh. B.7 - Regarding regression analysis: a. What assumptions...Ch. B.7 - Answer true or false to each of the following...Ch. B.7 - Answer true or false to each of the following...Ch. B.7 - Discuss what G. E. P. Box might have meant when he...Ch. B.7 - Regarding model validation in regression: a. What...Ch. B - Explain what is meant when we say that a nonlinear...Ch. B - Answer true or false to the following statements...Ch. B - Prob. 3RPCh. B - Prob. 4RPCh. B - Answer true or false to each of the following...Ch. B - Paper Strength. In their text, Introduction to...Ch. B - Answer true or false to each of the following...Ch. B - Prob. 8RPCh. B - Explain what is meant when we say that a...Ch. B - OUTPUT B.95 Output for Problem 10 Regression...Ch. B - In regressing a response variable on several...Ch. B - Answer true or false to each of the following...Ch. B - Fill in the blanks. a. Multicollinearity is...Ch. B - Prob. 14RPCh. B - Explain why selecting a regression equation using...Ch. B - Answer true or false to each of the following...Ch. B - Fill in the blanks. a. In the _____ method, we...Ch. B - Patent Production. In the report The State New...Ch. B - Prob. 19RPCh. B - Prob. 20RPCh. B - Patent Production. Refer to Problem 18. where we...Ch. B - Prob. 22RPCh. B - Prob. 23RPCh. B - What are the possible consequences of the presence...Ch. B - Windmill Output. Refer to Problem 3, where we...Ch. B - Paper Strength. Refer to Problem 6, where we...Ch. B - Diabetes. Refer to Problem 10, where we considered...Ch. B - Hospital Stalling. Refer to Problem 14, where we...Ch. B - Patent Production. Refer to Problem 18, where we...Ch. B - Patent Production. Refer to Problem 29, where we...Ch. B - Recall from Chapter 1 of your text that the Focus...Ch. B - At the beginning of this module on page B-l, we...
Knowledge Booster


Learn more about
Need a deep-dive on the concept behind this application? Look no further. Learn more about this topic, statistics and related others by exploring similar questions and additional content below.Similar questions
- A small community includes a farmer, a baker, and a grocer and has the input-output matrix D and external demand matrix E below.Solve for the output matrix X in the equation X = DX + E.arrow_forward20 Suppose Wesley is a marine biologist who is interested in the relationship between the age and the size of male Dungeness crabs. Wesley collects data on 1,000 crabs and uses the data to develop the following least-squares regression line where ?X is the age of the crab in months and ?ˆY^ is the predicted value of ?Y, the size of the male crab in cm. ?ˆ=8.2052+0.5693?Y^=8.2052+0.5693X What is the value of ?ˆY^ when a male crab is 21.7865 months old? Provide your answer with precision to two decimal places. ?ˆY^ = Interpret the value of ?ˆY^. The value of ?ˆY^ is the probability that a crab will be 21.7865 months old. the predicted incremental increase in size for every increase in age by 21.7865 months. the predicted size of a crab when it is 21.7865 months old. the predicted number of crabs out of the 1,000 crabs collected that will be 21.7865 months old.arrow_forwardConsider the example of injection moulding of a rubber component as shown in Figure Q3(b). The process engineer would like to optimise the strength of the component by optimising the following factors: temperature = 190°C and 210°C, pressure = 50 MPa and 100 MPa, and speed of injection = 10 mm/s and 50 mm/s. What type of mathematical model that the engineer can develop if the relationship is linear and no interactions are significant? Write down the general equation that relates the strength of the component with the process factors.arrow_forward
- Given the following table, use the matrix method to derive the constant and slope parameters of the sample regression function: Productivity index = f(Daily sleep hours). X and Y stand for the daily sleep hours and productivity index respectively. X (Daily sleep hours) Y (Productivity index)(X first then Y in pairs so )X= 2 Y= 30 X=4 Y=35 X=5 Y=40 X=6 Y=65 X=8 Y=80arrow_forward(a) Derive the least squares estimates of α and β for the centred form of the simple linear regression model given by yi =α+β(xi −x ̄)+εi i=1,2,...,n. (b) Check that the estimates do give a minimum in the same way as we saw for the standard form of the simple linear regression model.arrow_forwardYear t 0 1 2 3 4 iPod Sales S(millions) 22.6 39.4 51.9 54.8 54.8 (a) Find a quadratic regression model for these data. (Round coefficients to three significant digits.) S(t) =arrow_forward
- NaturalSciences Engineering SocialSciences Education 1990 70 10 60 30 1995 130 40 110 50 2000 330 130 280 120 2005 490 370 460 210 2010 590 550 830 520 2012 690 590 1,000 900 (a) With x = the number of social science doctorates and y = the number of education doctorates, use technology to obtain the regression equation. (Round coefficients to three significant digits.) y(x) =arrow_forward5. In simple linear regression: a.The larger the coefficient of determination, then the more precisely the y variable can be predicted from the x variable. b.The larger the coefficient of determination, then the less precisely the y variable can be predicted from the x variable. c.Neither of the above. d.Both of the above.arrow_forwardSTUDENT ID SLEEP (x) HOMEWORK (y) 1 360 30 2 400 45 3 420 60 4 440 15 5 540 75 6 480 120 7 320 80 8 440 60 9 300 90 10 420 30 11 500 60 12 400 20 13 440 60 14 300 30 15 360 80 16 480 100 17 410 25 18 430 15 19 330 60 20 480 30 Calculate the simple linear regression to determine the amount of time spent on homework can be predicted by amount of sleep. Graph the relationship and determine, numerically, if there are any outliers. In a paragraph, interpret all results.arrow_forward
- In a small barangay, there were a farmer, a baker, and a grocer and has the input-output matrix D and external demandmatrix E shown below. Solve for the output matrix X in the equation X = DX + E.arrow_forwardWhich of the following statements is/are true? Choices a None of these b Both Statements c The least square method provides estimate of system parameters by minimizing the sum of the squares of the differences between the observed values and the fitted or predicted values from the system. d The least square method for linear regression model assumes that the mean of the random dependent variable is related to an independent variable by following a straight-line relationship.arrow_forwardIn general Regression Matrix Model, Y=X??+e, X is Select one: a. None of these b. Kx1 column vector of parameters c. XxK matrix of observation on independent variables d. 1x1 matrix of independent variables e. Nx1 column vector of errorsarrow_forward
arrow_back_ios
SEE MORE QUESTIONS
arrow_forward_ios
Recommended textbooks for you

 Elementary Linear Algebra (MindTap Course List)AlgebraISBN:9781305658004Author:Ron LarsonPublisher:Cengage Learning
 Algebra & Trigonometry with Analytic GeometryAlgebraISBN:9781133382119Author:SwokowskiPublisher:Cengage
Elementary Linear Algebra (MindTap Course List)
Algebra
ISBN:9781305658004
Author:Ron Larson
Publisher:Cengage Learning
Algebra & Trigonometry with Analytic Geometry
Algebra
ISBN:9781133382119
Author:Swokowski
Publisher:Cengage
Correlation Vs Regression: Difference Between them with definition & Comparison Chart; Author: Key Differences;https://www.youtube.com/watch?v=Ou2QGSJVd0U;License: Standard YouTube License, CC-BY
Correlation and Regression: Concepts with Illustrative examples; Author: LEARN & APPLY : Lean and Six Sigma;https://www.youtube.com/watch?v=xTpHD5WLuoA;License: Standard YouTube License, CC-BY