Organic Chemistry (9th Edition)
9th Edition
ISBN: 9780321971371
Author: Leroy G. Wade, Jan W. Simek
Publisher: PEARSON
expand_more
expand_more
format_list_bulleted
Concept explainers
Videos
Textbook Question
Chapter 12.15A, Problem 12.9P
Show the fragmentations that give rise to the peaks at m/z 43, 57, and 85 in the mass spectrum of 2,4-dimethylpentane (Figure12-17).
| m/z | Abundance (% of base Peak) |
| 41 | 34 |
| 42 | 24 |
| 43(base peak) | 100 |
| 56 | 35 |
| 57 | 72 |
| 85 | 19 |
| 100 (M+) |
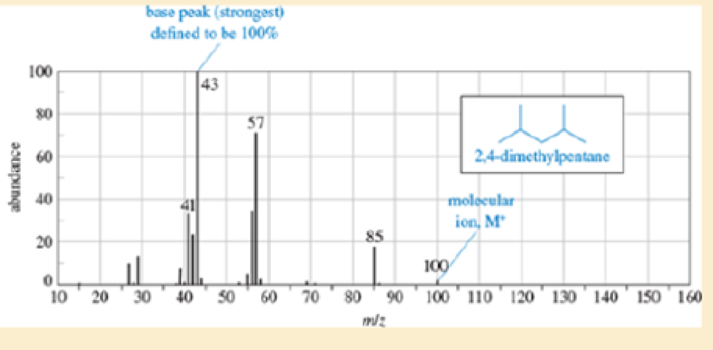
Figure 12-17
Expert Solution & Answer
Want to see the full answer?
Check out a sample textbook solution
Students have asked these similar questions
MS: m/z=148 (M,100%),149 (11%)
IR (liquid film): 3077‐2835 (multitude of weak peaks) 1640(m),1611(m),1511(s),1301(m),1247(s),1176(s),1038(s),922(m),914(m) and 810(m)cm^-1
There are no absorptions in the 3100-‐4000cm^-1 region of the spectrum. (m=medium absorption, s=strong absorption).
Choose (circle) the best structure for estragole (W) from the four possible structures (1-4)shown below. Explain briefly how you eliminated each of the incorrect structures for W.
HPLC VFA analysis - why do I get so different peaks for very similar samples?
Hello, I am stumped on this problem. Calculate the amount of extract and amount of TE^-4 needed to get an aliquot of 1 ng/20 uL for the given quantitation result; 2.5 ng/20 uL. do I divide the 2.5 ng by the 20 uL before using c1v1=c2v2? Thank you for any help
Chapter 12 Solutions
Organic Chemistry (9th Edition)
Ch. 12.3 - Complete the following conversion table. (cm1)...Ch. 12.5 - Which of the bonds shown in red are expected to...Ch. 12.7C - For each hydrocarbon spectrum, determine whether...Ch. 12.9A - Spectra are given for three compounds. Each...Ch. 12.10 - The infrared spectra for three compounds are...Ch. 12.12 - Prob. 12.6PCh. 12.14B - Identify which of these four mass spectra indicate...Ch. 12.15A - Show the fragmentation that accounts for the...Ch. 12.15A - Show the fragmentations that give rise to the...Ch. 12.15B - Ethers are not easily differentiated by their...
Ch. 12.15C - Prob. 12.11PCh. 12 - Prob. 12.12SPCh. 12 - Prob. 12.13SPCh. 12 - All of the following compounds absorb infrared...Ch. 12 - Prob. 12.15SPCh. 12 - Four infrared spectra are shown, corresponding to...Ch. 12 - Predict the masses and the structures of the most...Ch. 12 - Prob. 12.18SPCh. 12 - Prob. 12.19SPCh. 12 - (A true story) While organizing the undergraduate...Ch. 12 - Prob. 12.21SPCh. 12 - Prob. 12.22SPCh. 12 - An unknown, foul-smelling hydrocarbon gives the...Ch. 12 - covered a synthesis of alkynes by a double...Ch. 12 - Three IR spectra are shown, corresponding to three...Ch. 12 - Prob. 12.26SPCh. 12 - Prob. 12.27SPCh. 12 - Prob. 12.28SPCh. 12 - The ultimate test of fluency in MS and IR is...Ch. 12 - Prob. 12.30SPCh. 12 - Consider the following four structures, followed...
Knowledge Booster


Learn more about
Need a deep-dive on the concept behind this application? Look no further. Learn more about this topic, chemistry and related others by exploring similar questions and additional content below.Similar questions
- Identify the Campesterol peak of the GC-MS of Burn Morel mushrooms (Tomentosa) and the M (+/-) peaks that are present. Include the mass and signature intensities of the peaks main product.arrow_forwardMass spectrometry is an extremely versatile detection system for GC. However, interfacing an HPLC system to a mass spectrometer is a much more difficult task. Describe the major reasons why it is more difficult to combine HPLC with mass spectrometry than it is to combine GC with mass spectrometry.arrow_forwardAt what m/z are peaks expected to appear for the following?1) hexane2) ethyl methyl ether3) 4-heptanone. Show the fragments detected by the spectrometer using different fragmentation patterns.arrow_forward
- Make a sketch of the partial mass spectrum of 1-bromoheptane, showing the position of the peaks for: [Masses: H=1; C=12; Br=79 and Br=81 (isotopes)] i) The Molecular ion(s) ii) The fragments resulting from a split between carbons 3 and 4. iii) The fragments resulting from a split between carbons 5 and 6.arrow_forwardAfter creating her standard curve for absorption versus the concentration (M) of FD&C Red 40, a student found that her best fit linear line for FD&C Red 40 was y = 2,681x + -0.002. Her Kool-Aid sample had an absorbance of 0.337. If 0.55 grams of Kool-Aid powder was used to prepare an 8-fl oz cup of her assigned flavor, what is the percent by mass of FD&C Red 40 in her 8-fl oz cup?arrow_forwardA solution prepared by dissolving 25.8 mg of benzene (C6H6, FM 78.11) in hexane and diluting to 250.0 mL has an absorption peak at 256 nm, with an absorbance of 0.266 in a 1.000-cm cell. Hexane does not absorb at 256 nm. Find the molar absorptivity of benzene at this wavelength.arrow_forward
- With a resolution of 500 a peak will an m/z value of 297.000 from which of the following peaks? 297.439 297.603 297.356 298.000 297.232arrow_forwardCalculate the HDI of each FM and propose 2structures for two molecules that are isomers.Specify what the indicated absorption (s) shouldbe to.a.C7H15NO with strong absorptions in 3400, 3270and 1670, 1390, and 1370 cm-1b. C6H10O with absorptions in 2065 (m), 1685 (f),1650 (m) and 970 (f) cm-1c. C9H12O, with absorptions in 1600 and 1500 and1245 cm-1.arrow_forwardHow is the molar mass of 2-methyl-2-hexanol is different from the M+1 peak of the mass spectrum?arrow_forward
- What functional group can you get from its IR spectrum? Support your answer by identifying prominent peaks (wavenumbers cm^-1) and assigning the functional group.arrow_forward1.) Which solutions should you have used to make your Beer's Law Plot? 2.) What property of the product of your reaction allowed you to use visible spectroscopy to analyze your results? 3.) Using your absorbance value from Equilibrium mixture 5 (E5), show your calculation for the concentration of FeSCN^2+ in sample E5. (Provided picture for the resources)arrow_forward1a. Briefly explain 3 advantages and disadvantages of using ¹H-NMR for the quantitative analysis of organic compounds compared with HPLC-UV. 1b. Explain why an internal standard is needed in quantitative NMR and Indicate what information from the internal standard is required for quantitative analysis. 1c.Give 3 advantages and 3 disadvantages of GC-MS compared with GC-FID 1d . (Check the image below for q.1d)arrow_forward
arrow_back_ios
SEE MORE QUESTIONS
arrow_forward_ios
Recommended textbooks for you
 Macroscale and Microscale Organic ExperimentsChemistryISBN:9781305577190Author:Kenneth L. Williamson, Katherine M. MastersPublisher:Brooks Cole
 Principles of Instrumental AnalysisChemistryISBN:9781305577213Author:Douglas A. Skoog, F. James Holler, Stanley R. CrouchPublisher:Cengage Learning
 Organic ChemistryChemistryISBN:9781305580350Author:William H. Brown, Brent L. Iverson, Eric Anslyn, Christopher S. FootePublisher:Cengage Learning
Macroscale and Microscale Organic Experiments
Chemistry
ISBN:9781305577190
Author:Kenneth L. Williamson, Katherine M. Masters
Publisher:Brooks Cole
Principles of Instrumental Analysis
Chemistry
ISBN:9781305577213
Author:Douglas A. Skoog, F. James Holler, Stanley R. Crouch
Publisher:Cengage Learning
Organic Chemistry
Chemistry
ISBN:9781305580350
Author:William H. Brown, Brent L. Iverson, Eric Anslyn, Christopher S. Foote
Publisher:Cengage Learning
Mass Spectrometry; Author: Professor Dave Explains;https://www.youtube.com/watch?v=hSirWciIvSg;License: Standard YouTube License, CC-BY