
Cornerstones of Cost Management (Cornerstones Series)
4th Edition
ISBN: 9781305970663
Author: Don R. Hansen, Maryanne M. Mowen
Publisher: Cengage Learning
expand_more
expand_more
format_list_bulleted
Videos
Textbook Question
Chapter 14, Problem 3CE
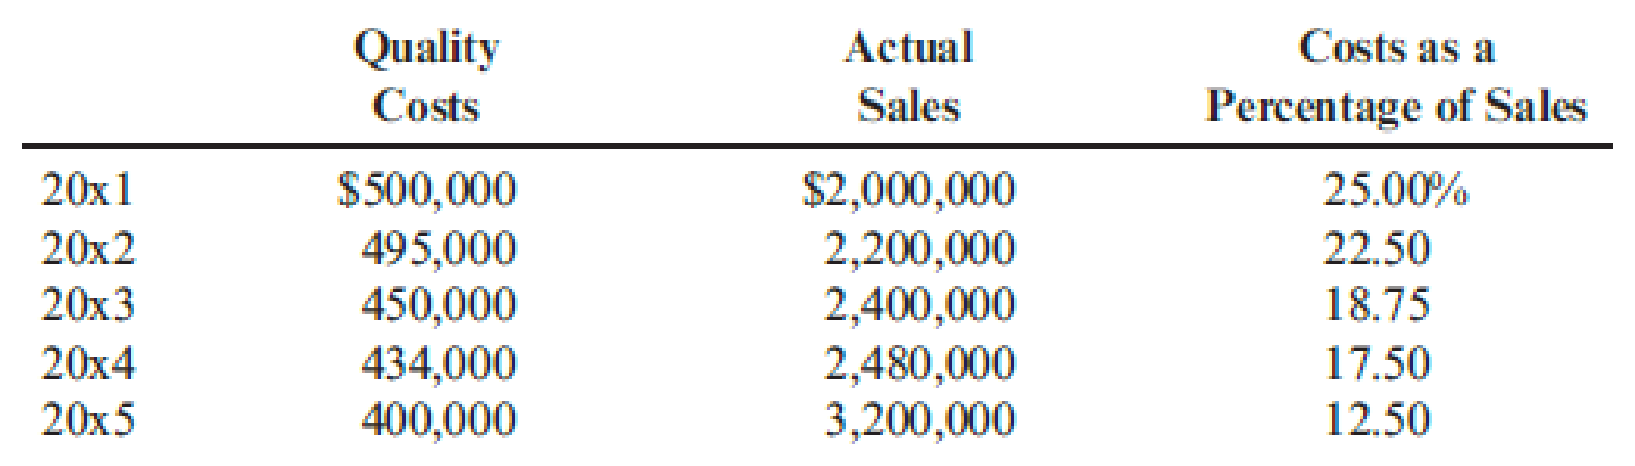
Ross Company implemented a quality improvement program and tracked the following for the five years:
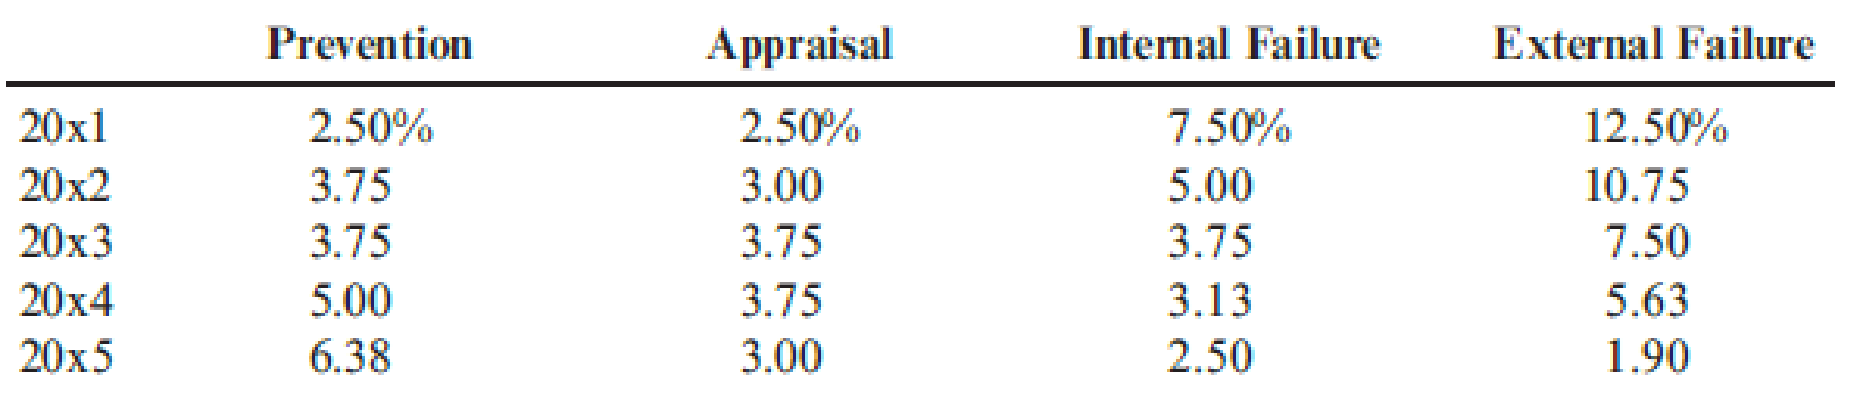
By cost category as a percentage of sales for the same period of time:
Required:
- 1. Prepare a bar graph that reveals the trend in quality cost as a percentage of sales (time on the horizontal axis and percentages on the vertical). Comment on the message of the graph.
- 2. Prepare a bar graph for each cost category as a percentage of sales. What does this graph tell you?
- 3. What if management would like to have the trend in relative distribution of quality costs? Express this as a bar graph and comment on its significance.
Expert Solution & Answer
Want to see the full answer?
Check out a sample textbook solution
Students have asked these similar questions
Recognising that there would be fierce competition to regain lost markets, Management felt that there should be a renewed focus on the productivity and profitability of the operations.
The productivity analysis would focus on the Manufacturing department, and the profitability would examine both products.
To conduct this analysis, you have extracted the following information for the Manufacturing Department for the month of January:
At the start of the month there were 1,000 units in stock, which were 20% complete with respect to conversion costs, and was valued at $ 16,000.
During the month, 9,000 units were introduced to the production.
At the end of the month there were 1,000 units in stock which were 40% complete with respect to conversion costs.
All Materials are added at the start of the process.
Costs incurred for the month were: Materials - $ 63,000; Conversion costs - $ 139,840.
The Department uses a FIFO costing system.
Further examination of the records showed the…
Chapter 14 Solutions
Cornerstones of Cost Management (Cornerstones Series)
Ch. 14 - What is the difference between quality of design...Ch. 14 - Why are quality costs the costs of doing things...Ch. 14 - Prob. 3DQCh. 14 - Describe the Taguchi quality loss function, and...Ch. 14 - Identify and discuss the four kinds of quality...Ch. 14 - Explain why external failure costs can be more...Ch. 14 - Prob. 7DQCh. 14 - Prob. 8DQCh. 14 - Describe the three types of quality performance...Ch. 14 - Prob. 10DQ
Ch. 14 - If a firms annual sales are 200 million, what...Ch. 14 - Explain why it is important for a manager to...Ch. 14 - Prob. 13DQCh. 14 - Explain why the Accounting Department should be...Ch. 14 - Prob. 15DQCh. 14 - What is ecoefficiency?Ch. 14 - Prob. 17DQCh. 14 - Prob. 18DQCh. 14 - Prob. 19DQCh. 14 - What are the four categories of environmental...Ch. 14 - Prob. 21DQCh. 14 - What does full environmental costing mean? Full...Ch. 14 - What information is communicated by the unit...Ch. 14 - Evans Company had total sales of 3,000,000 for...Ch. 14 - Prob. 2CECh. 14 - Ross Company implemented a quality improvement...Ch. 14 - Nabors Company had actual quality costs for the...Ch. 14 - Verde Company reported operating costs of...Ch. 14 - Pinter Company had the following environmental...Ch. 14 - Rachel Boyce, president of a company that...Ch. 14 - Quality attributes such as performance and...Ch. 14 - Stahman, Inc., estimates its hidden external...Ch. 14 - Prob. 10ECh. 14 - Abernathy, Inc., produces two different generators...Ch. 14 - Kang Company reported sales of 3,240,000 in 20x5....Ch. 14 - Gagnon Company reported the following sales and...Ch. 14 - Muskogee Company had sales of 60,000,000 in 20x1....Ch. 14 - Javier Company has sales of 8 million and quality...Ch. 14 - In 20x4, Tru-Delite Frozen Desserts, Inc.,...Ch. 14 - Prob. 17ECh. 14 - Prob. 18ECh. 14 - Achieving sustainable development will likely...Ch. 14 - Classify the following environmental activities as...Ch. 14 - At the end of 20x5, Bing Pharmaceuticals began to...Ch. 14 - Prob. 22ECh. 14 - Coyle Pharmaceuticals produces two organic...Ch. 14 - Prob. 24ECh. 14 - Which of the following quality costs is an...Ch. 14 - Which of the following would be a hidden quality...Ch. 14 - Using the Taguchi quality loss function, an...Ch. 14 - Environmental costs are those costs incurred...Ch. 14 - Two products, Product A and Product B, are...Ch. 14 - Kathy Shorts, president of Oliver Company, was...Ch. 14 - Panguitch Company manufactures a component for...Ch. 14 - Gaston Company manufactures furniture. One of its...Ch. 14 - Classify the following quality costs as...Ch. 14 - Wayne Johnson, president of Banshee Company,...Ch. 14 - Recently, Ulrich Company received a report from an...Ch. 14 - In 20x5, Major Company initiated a full-scale,...Ch. 14 - Paper Products Division produces paper diapers,...Ch. 14 - In 2011, Milton Thayne, president of Carbondale...Ch. 14 - Iona Company, a large printing company, is in its...Ch. 14 - Prob. 40PCh. 14 - The following items are listed in an environmental...Ch. 14 - Refer to Problem 14.41. In the environmental...Ch. 14 - The following environmental cost reports for 20x3,...Ch. 14 - Refer to Problem 14.43. In 20x3, Jack Carter,...
Knowledge Booster


Learn more about
Need a deep-dive on the concept behind this application? Look no further. Learn more about this topic, accounting and related others by exploring similar questions and additional content below.Similar questions
- Pintura Company implemented a quality improvement program and tracked the following for the five years: By cost category as a percentage of sales for the same period of time: Required: 1. Prepare a bar graph that reveals the trend in quality cost as a percentage of sales (time on the horizontal axis and percentages on the vertical). Comment on the message of the graph. 2. Prepare a bar graph for each cost category as a percentage of sales. What does this graph tell you?arrow_forwardNorris Company implemented a quality improvement program and tracked the following for the 5 years: By cost category of sales for the same period of time: Required: 1. Prepare a bar graph (hat reveals the trend in quality cost as a percentage of sales (time on horizontal axis and percentages on the vertical). Comment on the message of the graph. 2. Prepare a bar graph for each cost category as a percentage of sales. What does this graph tell you?arrow_forwardThe controller of Emery, Inc. has computed quality costs as a percentage of sales for the past 5 years (20X1 was the first year the company implemented a quality improvement program). This information is as follows: Required: 1. Prepare a trend graph for total quality costs. Comment on what the graph has to say about the success of the quality improvement program. 2. Prepare a graph that shows the trend for each quality cost category. What does the graph have to say about the success of the quality improvement program? Does this graph supply more insight than the total cost trend graph does? 3. Prepare a graph that compares the trend in relative control costs versus relative failure costs. Comment on the significance of this trend.arrow_forward
- Gagnon Company reported the following sales and quality costs for the past four years. Assume that all quality costs are variable and that all changes in the quality cost ratios are due to a quality improvement program. Required: 1. Compute the quality costs for all four years. By how much did net income increase from Year 1 to Year 2 because of quality improvements? From Year 2 to Year 3? From Year 3 to Year 4? 2. The management of Gagnon Company believes it is possible to reduce quality costs to 2.5 percent of sales. Assuming sales will continue at the Year 4 level, calculate the additional profit potential facing Gagnon. Is the expectation of improving quality and reducing costs to 2.5 percent of sales realistic? Explain. 3. Assume that Gagnon produces one type of product, which is sold on a bid basis. In Years 1 and 2, the average bid was 400. In Year 1, total variable costs were 250 per unit. In Year 3, competition forced the bid to drop to 380. Compute the total contribution margin in Year 3 assuming the same quality costs as in Year 1. Now, compute the total contribution margin in Year 3 using the actual quality costs for Year 3. What is the increase in profitability resulting from the quality improvements made from Year 1 to Year 3?arrow_forwardAt the end of 20x1, Mejorar Company implemented a low-cost strategy to improve its competitive position. Its objective was to become the low-cost producer in its industry. A Balanced Scorecard was developed to guide the company toward this objective. To lower costs, Mejorar undertook a number of improvement activities such as JIT production, total quality management, and activity-based management. Now, after two years of operation, the president of Mejorar wants some assessment of the achievements. To help provide this assessment, the following information on one product has been gathered: Required: 1. Compute the following measures for 20x1 and 20x3: a. Actual velocity and cycle time b. Percentage of total revenue from new customers (assume one unit per customer) c. Percentage of very satisfied customers (assume each customer purchases one unit) d. Market share e. Percentage change in actual product cost (for 20x3 only) f. Percentage change in days of inventory (for 20x3 only) g. Defective units as a percentage of total units produced h. Total hours of training i. Suggestions per production worker j. Total revenue k. Number of new customers 2. For the measures listed in Requirement 1, list likely strategic objectives, classified according to the four Balance Scorecard perspectives. Assume there is one measure per objective.arrow_forwardKang Company reported sales of 3,240,000 in 20x5. At the end of the calendar year, the following quality costs were reported: Required: 1. Prepare a quality cost report. 2. Prepare a graph (pie chart or bar graph) that shows the relative distribution of quality costs, and comment on the distribution.arrow_forward
- Evans Company had total sales of 3,000,000 for fiscal 20x5. The costs of quality-related activities are given below. Required: 1. Prepare a quality cost report, classifying costs by category and expressing each category as a percentage of sales. What message does the cost report provide? 2. Prepare a bar graph and pie chart that illustrate each categorys contribution to total quality costs. Comment on the significance of the distribution. 3. What if, five years from now, quality costs are 7.5 percent of sales, with control costs being 65 percent of the total quality costs? What would your conclusion be?arrow_forwardBradshaw Company reported sales of 5,000,000 in 20X1. At the end of the fiscal year (June 30, 20X1), the following quality costs were reported: Required: 1. Prepare a quality cost report. 2. Prepare a graph (pie chart or bar graph) that shows the relative distribution of quality costs, and comment on the distribution. 3. Assuming sales of 5,000,000, by how much would profits increase if quality improves so that quality costs are only 3% of sales?arrow_forwardIn 20X1, Don Blackburn, president of Price Electronics, received a report indicating that quality costs were 31% of sales. Faced with increasing pressures from imported goods. Don resolved to take measures to improve the overall quality of the companys products. After hiring a consultant in 20X1, the company began an aggressive program of total quality control. At the end of 20X5, Don requested an analysis of the progress the company had made in reducing and controlling quality costs. The accounting department assembled the following data: Required: 1. Compute the quality costs as a percentage of sales by category and in total for each year. 2. Prepare a multiple-year trend graph for quality costs, both by total costs and by category. Using the graph, assess the progress made in reducing and controlling quality costs. Does the graph provide evidence that quality has improved? Explain. 3. Using the 20X1 quality cost relationships (assume all costs are variable), calculate the quality costs that would have prevailed in 20X4. By how much did profits increase in 20X4 because of the quality improvement program? Repeat for 20X5.arrow_forward
- Jarriot, Inc., presented two years of data for its Furniture Division and its Houseware Division. Required: 1. Compute the ROI and the margin and turnover ratios for each year for the Furniture Division. (Round your answers to four significant digits.) 2. Compute the ROI and the margin and turnover ratios for each year for the Houseware Division. (Round your answers to four significant digits.) 3. Explain the change in ROI from Year 1 to Year 2 for each division.arrow_forwardMerkley Company, a manufacturer of machine parts, implemented lean manufacturing at the end of 20X1. Three value streams were established: one for new product development and two order fulfillment value streams. One of the value streams set a goal to increase its ROS to 45% of sales by the end of the year. During the year, the value stream made significant improvements in several areas. The Box Scorecard below was prepared, with performance measures for the beginning of the year, midyear, and end of year. Although the members of the value stream were pleased with their progress, they were disappointed in the financial results. They were still far from the targeted ROS of 45%. They were also puzzled as to why the improvements made did not translate into significantly improved financial performance. Required: 1. From the scorecard, what was the focus of the value-stream team for the first 6 months? The second 6 months? What are the implications of these changes? 2. Using information from the scorecard, offer an explanation for why the financial results were not as good as expected.arrow_forwardQuality Cost Report Loring Company had total sales of 2,400,000 for fiscal 20X1. The costs of quality-related activities are given below. Required: 1. Prepare a quality cost report, classifying costs by category and expressing each category as a percentage of sales. What message does the cost report provide? 2. Prepare a bar graph and pie chart that illustrate each categorys contribution to total quality costs. Comment on the significance of the distribution.arrow_forward
arrow_back_ios
SEE MORE QUESTIONS
arrow_forward_ios
Recommended textbooks for you
 Cornerstones of Cost Management (Cornerstones Ser...AccountingISBN:9781305970663Author:Don R. Hansen, Maryanne M. MowenPublisher:Cengage Learning
 Managerial Accounting: The Cornerstone of Busines...AccountingISBN:9781337115773Author:Maryanne M. Mowen, Don R. Hansen, Dan L. HeitgerPublisher:Cengage Learning
 Managerial AccountingAccountingISBN:9781337912020Author:Carl Warren, Ph.d. Cma William B. TaylerPublisher:South-Western College Pub
 Essentials of Business Analytics (MindTap Course ...StatisticsISBN:9781305627734Author:Jeffrey D. Camm, James J. Cochran, Michael J. Fry, Jeffrey W. Ohlmann, David R. AndersonPublisher:Cengage Learning
Cornerstones of Cost Management (Cornerstones Ser...
Accounting
ISBN:9781305970663
Author:Don R. Hansen, Maryanne M. Mowen
Publisher:Cengage Learning
Managerial Accounting: The Cornerstone of Busines...
Accounting
ISBN:9781337115773
Author:Maryanne M. Mowen, Don R. Hansen, Dan L. Heitger
Publisher:Cengage Learning
Managerial Accounting
Accounting
ISBN:9781337912020
Author:Carl Warren, Ph.d. Cma William B. Tayler
Publisher:South-Western College Pub
Essentials of Business Analytics (MindTap Course ...
Statistics
ISBN:9781305627734
Author:Jeffrey D. Camm, James J. Cochran, Michael J. Fry, Jeffrey W. Ohlmann, David R. Anderson
Publisher:Cengage Learning
Inspection and Quality control in Manufacturing. What is quality inspection?; Author: Educationleaves;https://www.youtube.com/watch?v=Ey4MqC7Kp7g;License: Standard youtube license