
APPLIED STAT.IN BUS.+ECONOMICS
6th Edition
ISBN: 9781259957598
Author: DOANE
Publisher: RENT MCG
expand_more
expand_more
format_list_bulleted
Concept explainers
Videos
Textbook Question
Chapter 14.5, Problem 7SE
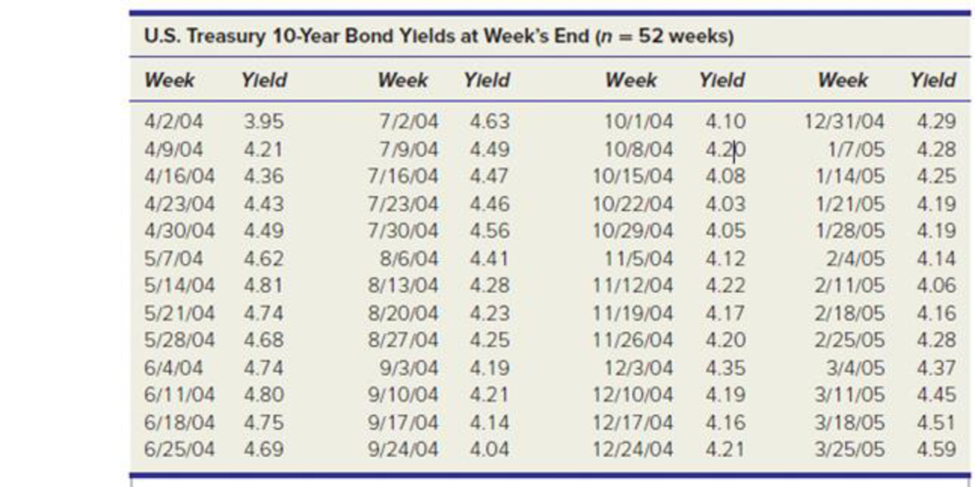
(a) Make an Excel line graph of the following bond yield data. Describe the pattern. Is there a consistent trend? (b) Perform exponential smoothing with α = .20. Use both methods A and B to initialize the forecast. Record the statistics of fit. (c) Do the smoothing again with α = .10 and then with α = .30, recording the statistics of fit. (d) Compare the statistics of fit for the three values of α. (e) Make a one-period forecast (i.e., t = 53) using each of the three α values. How did α affect your forecasts?
Expert Solution & Answer
Want to see the full answer?
Check out a sample textbook solution
Students have asked these similar questions
Use the basic equation for the capital asset pricing model (CAPM) to Find the risk-free rate for a firm with a required return of 15% and a beta of 1.25 when the market return is 14%
With the gasoline time series data from table 17.1, show the exponential smoothing forecasts using a = .1.a. applying the MSe measure of forecast accuracy, would you prefer a smoothing constant of a = .1 or a = .2 for the gasoline sales time series?b. are the results the same if you apply Mae as the measure of accuracy?c. What are the results if Mape is used?
Storrs Cycles has just started selling the new Cyclonemountain bike, with monthly sales as shown in the table. First,co-owner Bob Day wants to forecast by exponential smoothingby initially setting February’s forecast equal to January’s saleswith a = .1. Co-owner Sherry Snyder wants to use a three-periodmoving average.
a) Is there a strong linear trend in sales over time?b) Fill in the table with what Bob and Sherry each forecast forMay and the earlier months, as relevant.c) Assume that May’s actual sales figure turns out to be 405.Complete the table’s columns and then calculate the meanabsolute deviation for both Bob’s and Sherry’s methods.d) Based on these calculations, which method seems moreaccurate?
Chapter 14 Solutions
APPLIED STAT.IN BUS.+ECONOMICS
Ch. 14.2 - (a) Make an Excel graph of the data on the number...Ch. 14.2 - Prob. 3SECh. 14.2 - Prob. 4SECh. 14.2 - Prob. 5SECh. 14.4 - (a) Make an Excel line graph of the exchange rate...Ch. 14.5 - (a) Make an Excel line graph of the following bond...Ch. 14 - Explain the difference between (a) stocks and...Ch. 14 - (a) What is periodicity? (b) Give original...Ch. 14 - (a) What are the distinguishing features of each...Ch. 14 - Name four criteria for assessing a trend forecast.
Ch. 14 - Name two advantages and two disadvantages of each...Ch. 14 - When would the exponential trend model be...Ch. 14 - Explain how to obtain the compound percent growth...Ch. 14 - (a) When might a quadratic model be useful? (b)...Ch. 14 - Name five measures of fit for a trend, and state...Ch. 14 - Prob. 10CRCh. 14 - Prob. 11CRCh. 14 - Prob. 12CRCh. 14 - (a) Why is seasonality irrelevant for annual data?...Ch. 14 - Prob. 14CRCh. 14 - (a) Explain how seasonal binaries can be used to...Ch. 14 - What is the purpose of index numbers?Ch. 14 - (a) Make a line chart for JetBlues revenue. (b)...Ch. 14 - (a) Plot both Swiss watch time series on the same...Ch. 14 - (a) Make a line graph of the U.S. civilian labor...Ch. 14 - (a) Plot the voter participation rate. (b)...Ch. 14 - For each of the following fitted trends, make a...Ch. 14 - (a) Make a line graph of consumer credit...Ch. 14 - (a) Plot the data on U.S. general aviation...Ch. 14 - Prob. 17CECh. 14 - (a) Plot either receipts and outlays or federal...Ch. 14 - Prob. 19CECh. 14 - (a) Plot the data on leisure and hospitality...Ch. 14 - Prob. 21CECh. 14 - Prob. 22CECh. 14 - (a) Plot the data on skier/snowboard visits. (b)...Ch. 14 - Prob. 24CECh. 14 - (a) Plot U.S. petroleum imports on a graph. (b)...Ch. 14 - (a) Make a line chart and fit an m-period moving...Ch. 14 - Refer to exercise 14.26. (a) Plot the dollar/pound...Ch. 14 - (a) Plot the data on natural gas bills. (b) Can...Ch. 14 - (a) Plot the data on air travel delays. (b) Can...Ch. 14 - (a) Plot the data on airplane shipments. (b) Can...Ch. 14 - (a) Plot the data on revolving credit (credit...Ch. 14 - The following seasonal regression was fitted with...Ch. 14 - The following seasonal regression was fitted with...
Knowledge Booster


Learn more about
Need a deep-dive on the concept behind this application? Look no further. Learn more about this topic, statistics and related others by exploring similar questions and additional content below.Similar questions
- t Date Rate 1 1-Apr-04 1.8564 2 2-Apr-04 1.8293 3 5-Apr-04 1.8140 4 6-Apr-04 1.8374 5 7-Apr-04 1.8410 6 8-Apr-04 1.8325 7 9-Apr-04 1.8322 8 12-Apr-04 1.8358 9 13-Apr-04 1.8160 10 14-Apr-04 1.7902 11 15-Apr-04 1.7785 12 16-Apr-04 1.8004 13 19-Apr-04 1.8055 14 20-Apr-04 1.7914 15 21-Apr-04 1.7720 16 22-Apr-04 1.7684 17 23-Apr-04 1.7674 18 26-Apr-04 1.7857 19 27-Apr-04 1.7925 20 28-Apr-04 1.7720 21 29-Apr-04 1.7751 22 30-Apr-04 1.7744 23 3-May-04 1.7720 24 4-May-04 1.7907 25 5-May-04 1.7932 26 6-May-04 1.7941 27 7-May-04 1.7842 28 10-May-04 1.7723 29 11-May-04 1.7544 30 12-May-04 1.7743 31 13-May-04 1.7584 32 14-May-04 1.7572 33 17-May-04 1.7695 34 18-May-04 1.7695 35 19-May-04 1.7827 36 20-May-04 1.7710 37 21-May-04 1.7880 38 24-May-04 1.7908 39 25-May-04 1.8135 40 26-May-04 1.8142 41 27-May-04 1.8369 42 28-May-04 1.8330 (a) Make a line chart and fit an m-period moving average to the exchange rate…arrow_forwardAn investment of $100 produces rate of return as follows In year 1: a gain of 10 percent In year 2: a loss of percent In year 3: a loss of 8 percent In year 4: a gain of 3 percent. Calculate the value of the investment at the end of the fourth year and calculate the mean annual rate of return.arrow_forwardSuppose that the Perpetual Help College of Rizal had the following record of its growth of enrollment from 2011 -2020. Year Enrolment Year Enrolment 2011 5,200 2016 7,000 2012 5,500 2017 8,800 2013 6,000 2018 9,400 2014 6,500 2019 9,600 2015 6,800 2020 10,500 c) Using exponential smoothing and smoothing constant of .30 and 2011 previous forecast of 5200, develop a forecast of enrolment from 2012 to 2021. d) Forecast enrollment using Trend line Projection from 2011 to 2021. e) Evaluate forecast accuracy of each forecast model using MSE .…arrow_forward
- The table shows the sales revenue from the past 8 quarters. What is the 4-period moving average forecast of the next quarter? Year 1 Year 2 Year 3 Q1 Q2 Q3 Q4 Q1 Q2 Q3 Q4 Q1 11 10 9 12 10 7 7 11 ?arrow_forwardTrue or False Using CAGR can help investors compare growth rates over time between two companies or funds that would otherwise be difficult to compare due to volatility in year-to-year growth.arrow_forwardA proposed project has the following cash flow estimates.Assuming statistically independent cash flows, a normally distributed net present value, and a minimum attractive rate of return of 15%, determine the following. For the following questions, employ an analytical solution: a. the mean and standard deviation of net present value. b. the probability that the net present value is negative. c. the probability that the net present value is greater than $1,000,000. Assume the initial investment and annual receipts are normally distributed. d. Using a Monte Carlo simulation with 10,000 iterations, estimate the probability that the present worth is negative.arrow_forward
- Compute the forecasted values for Yt for July and August in 2020 by using the modelsstated in (c) and (d)arrow_forwardAfter its move in 1990 to La Junta, Colorado, and its new initiatives, the DeBourgh Manufacturing Company began an upward climb of record sales. Suppose the figures shown here are the DeBourgh monthly sales figures from January 2001 through December 2009 (in $1,000s). a) Produce a time series plot. Are there any trends evident in the data? Does DeBourgh have a seasonal component to its sales? b) Deseasonalize the data using Multiplicative model with a 0.5 weighted moving average. Produce a time series plot of the deseasonalized data and add a trendline. c) Forecast the sales from January to December of the year 2010. d) Include a discussion of the general direction of sales and any seasonal tendencies that might be occurrinG Month 2001 2002 2003 2004 2005 2006 2007 2008 2009 January 139.7 165.1 177.8 228.6 266.7 431.8 381 431.8 495.3 February 114.3 177.8 203.2 254 317.5 457.2 406.4 444.5 533.4 March 101.6 177.8 228.6 266.7 368.3 457.2 431.8 495.3 635 April 152.4 203.2…arrow_forwardA proposed project has the following cash flow estimates. Assuming independent cash flows, a normally distributed net present value, and a minimum attractive rate of return of 18%, determine the following. For the following questions, employ an analytical solution: a. The mean and standard deviation of net present value. b. The probability that the net present value is positive. c. The probability that the net present value is greater than $5,000. Assume the initial investment and annual receipts are normally distributed. d. Using a Monte Carlo simulation with 10,000 iterations, estimate the probability that the present worth is positive and estimate the probability that the present worth is greater than $5,000.arrow_forward
- Metropolitan Hospital has estimated its average monthly bed needs, N, as: N=460+9X�=460+9� where X = time period (months); (January 2002 = 0) Assume that no new hospital additions are expected in the area in the foreseeable future. The following monthly seasonal adjustment factors have been estimated, using data from the past five years: Forecast Metropolitan's bed demand for January, April, July, November, and December 2007. Month Adjustment Factor (%) Forecast January +5 April -15 July +4 November -5 December -25 Suppose the following actual and forecast values for June bed demands have been recorded. Year Forecast Actual 2007 1,045 1,139 2006 937 974 2005 829 895 2004 721 743 2003 613 656 2002 505 515 What seasonal adjustment factor would you recommend be used in making future June forecasts? 2.1% 5.5% 1.3%arrow_forwardThe following ratio-to-moving averages for the seasonally adjusted series were found by the decomposition method applied on a time series representing quarterly sales for January 2018 to December 2020 period: a. Calculate the Seasonal Index for every quarter. b. If the trend is described by the trend line T^ = 1,000 + 30 t, what is the forecast for the fourth quarter of 2021?arrow_forwardThe earnings, dividends, and stock price of Shelby Inc. are expected to grow at 4% per year in the future. Shelby's common stock sells for $28 per share, its last dividend was $2.50, and the company will pay a dividend of $2.60 at the end of the current year. a. Using the discounted cash flow approach, what is its cost of equity? Round your answer to two decimal places. b. If the firm's beta is 1.1, the risk-free rate is 9%, and the expected return on the market is 13%, then what would be the firm's cost of equity based on the CAPM approach? Round your answer to two decimal places. c. If the firm's bonds earn a return of 10%, then what would be your estimate of rs using the own-bond-yield-plus-judgmental-risk-premium approach? (Hint: Use the mid-point of the risk premium range.) Round your answer to two decimal places. d. On the basis of the results of parts a–c, what would be your estimate of Shelby's cost of equity? Assume Shelby values each approach equally. Round your answer to two…arrow_forward
arrow_back_ios
SEE MORE QUESTIONS
arrow_forward_ios
Recommended textbooks for you
 MATLAB: An Introduction with ApplicationsStatisticsISBN:9781119256830Author:Amos GilatPublisher:John Wiley & Sons Inc
 Probability and Statistics for Engineering and th...StatisticsISBN:9781305251809Author:Jay L. DevorePublisher:Cengage Learning
 Statistics for The Behavioral Sciences (MindTap C...StatisticsISBN:9781305504912Author:Frederick J Gravetter, Larry B. WallnauPublisher:Cengage Learning
 Elementary Statistics: Picturing the World (7th E...StatisticsISBN:9780134683416Author:Ron Larson, Betsy FarberPublisher:PEARSON
 The Basic Practice of StatisticsStatisticsISBN:9781319042578Author:David S. Moore, William I. Notz, Michael A. FlignerPublisher:W. H. Freeman
 Introduction to the Practice of StatisticsStatisticsISBN:9781319013387Author:David S. Moore, George P. McCabe, Bruce A. CraigPublisher:W. H. Freeman
MATLAB: An Introduction with Applications
Statistics
ISBN:9781119256830
Author:Amos Gilat
Publisher:John Wiley & Sons Inc
Probability and Statistics for Engineering and th...
Statistics
ISBN:9781305251809
Author:Jay L. Devore
Publisher:Cengage Learning
Statistics for The Behavioral Sciences (MindTap C...
Statistics
ISBN:9781305504912
Author:Frederick J Gravetter, Larry B. Wallnau
Publisher:Cengage Learning
Elementary Statistics: Picturing the World (7th E...
Statistics
ISBN:9780134683416
Author:Ron Larson, Betsy Farber
Publisher:PEARSON
The Basic Practice of Statistics
Statistics
ISBN:9781319042578
Author:David S. Moore, William I. Notz, Michael A. Fligner
Publisher:W. H. Freeman
Introduction to the Practice of Statistics
Statistics
ISBN:9781319013387
Author:David S. Moore, George P. McCabe, Bruce A. Craig
Publisher:W. H. Freeman
Use of ALGEBRA in REAL LIFE; Author: Fast and Easy Maths !;https://www.youtube.com/watch?v=9_PbWFpvkDc;License: Standard YouTube License, CC-BY
Compound Interest Formula Explained, Investment, Monthly & Continuously, Word Problems, Algebra; Author: The Organic Chemistry Tutor;https://www.youtube.com/watch?v=P182Abv3fOk;License: Standard YouTube License, CC-BY
Applications of Algebra (Digit, Age, Work, Clock, Mixture and Rate Problems); Author: EngineerProf PH;https://www.youtube.com/watch?v=Y8aJ_wYCS2g;License: Standard YouTube License, CC-BY