
Concept explainers
Videos
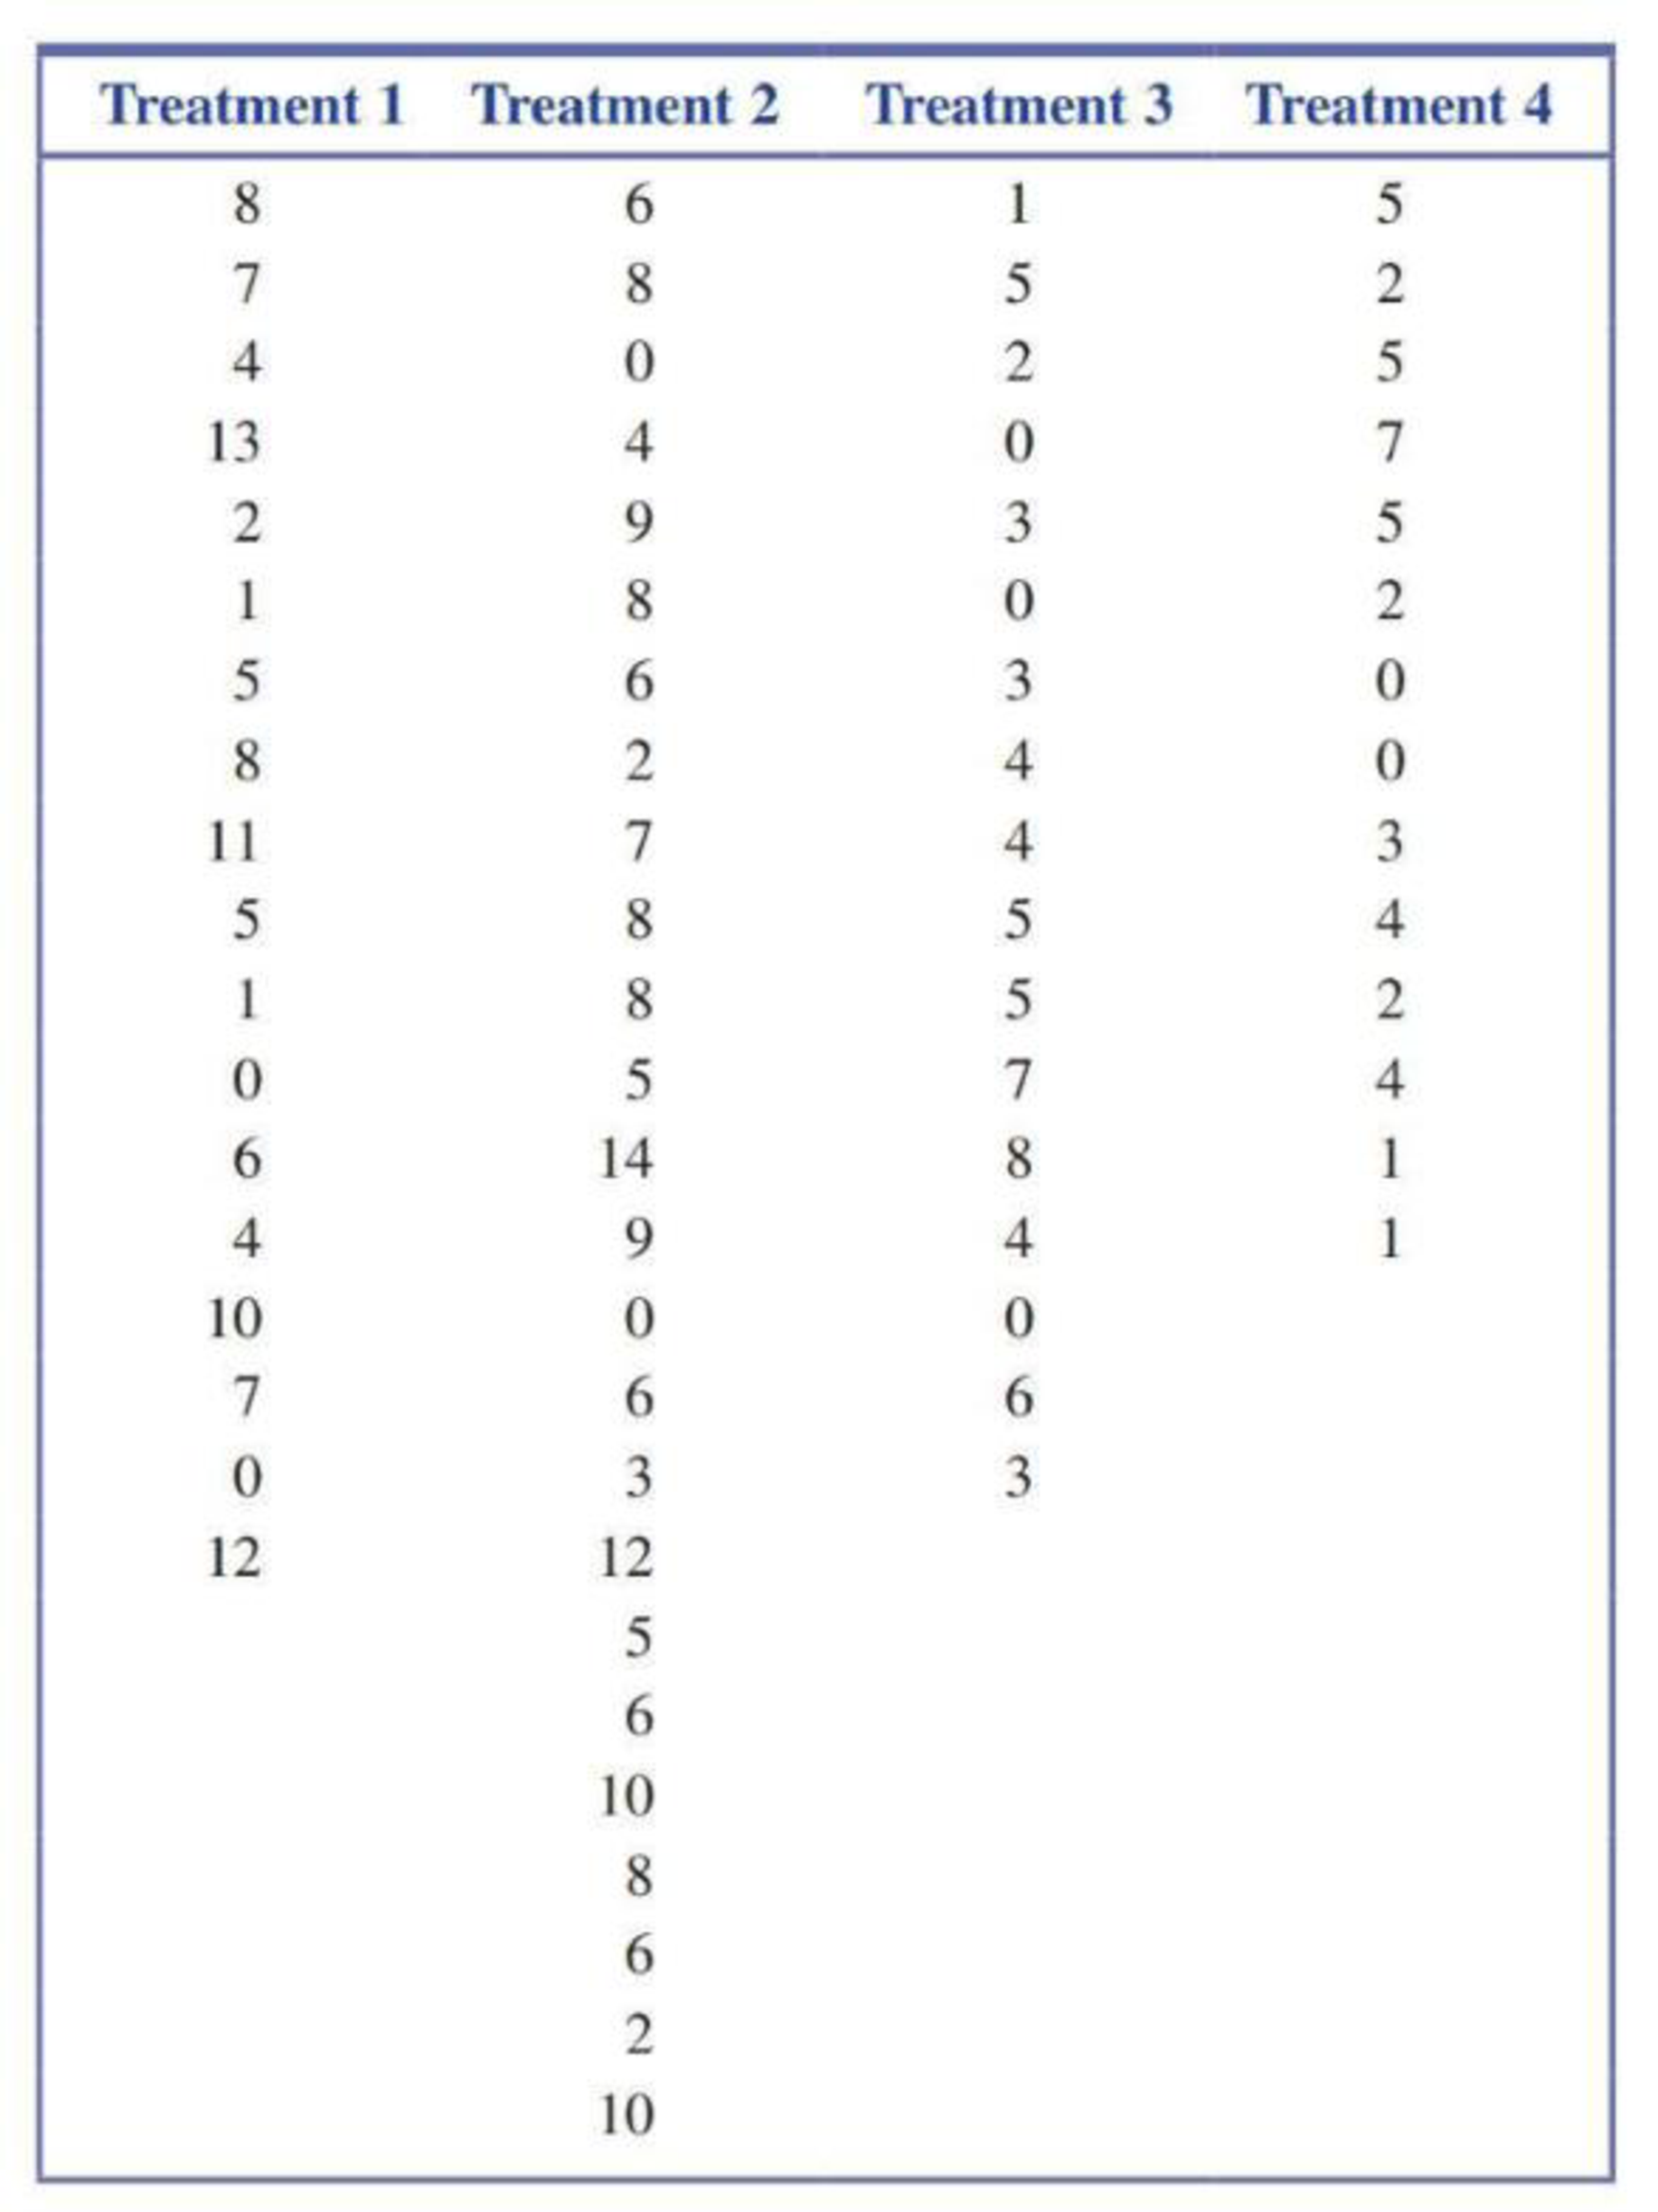
The Paper “Women’s and Men’s Eating Behavior Following Exposure to Ideal-Body Images and Text” (Communication Research [2006]: 507–529) describes an experiment in which 74 men were assigned at random to one of four treatments:
- 1. Viewed slides of fit, muscular men
- 2. Viewed slides of fit, muscular men accompanied by diet and fitness-related text
- 3. Viewed slides of fit, muscular men accompanied by text not related to diet and fitness
- 4. Did not view any slides
The participants then went to a room to complete a questionnaire. In this room, bowls of pretzels were set out on the tables. A research assistant noted how many pretzels were consumed by each participant while completing the questionnaire. Data consistent with summary quantities given in the paper are given in the accompanying table.
Do these data provide convincing evidence that the means for the numbers of pretzels consumed are not the same for all four treatments? Test the relevant hypotheses using a significance level of 0.05.
Want to see the full answer?
Check out a sample textbook solution
Chapter 15 Solutions
Introduction To Statistics And Data Analysis


- In a study of a group of women science majors who remained in their profession and a group who left their profession within a few months of graduation, the researchers collected the data shown here on a self-esteem questionnaire. Leavers Stayers1 = 3.05 2 = 2.92σ1 = 0.71 σ2 = 0.71n1 = 100 n2 = 227At α = 0.05, can it be concluded that there is a difference in the self-esteem scores of the two groups? Use the P-value method.arrow_forward3. The paper "Effects of Caffeine on Repeated Sprint Ability, Reactive Agility Time, Sleep and Next Day Performance"† describes an experiment in which male athlete volunteers who were considered low caffeine consumers were assigned at random to one of two experimental groups. Those assigned to the caffeine group drank a beverage which contained caffeine 1 hour before an exercise session. Those in the no-caffeine group drank a beverage that did not contain caffeine 1 hour before an exercise session. That night, participants wore a device that measures sleep activity. The researchers reported that there was no significant difference in mean sleep duration for the two experimental groups. In the context of this experiment, explain what it means to say that there is no significant difference in the group means. A) The difference in mean sleep duration for the caffeine and no-caffeine groups could have occurred by chance just due to the random assignment, assuming there is a real difference…arrow_forwardA study in Sweden looked at former elite soccer players, people who had played soccer but not at the elite level, and people of the same age who did not play soccer. Here is a two-way table that classifies these subjects by whether or not they had arthritis of the hip or knee by their mid-fifties: Elite Non-elite Did not play Arthritis 10 9 24 No arthritis 61 206 548 Based on this study, you can conclude thatarrow_forward
- In the journal Mental Retardation, an article reported the results of a peer tutoring program to help mildly mentally retarded children learn to read. In the experiment, the mildly retarded children were randomly divided into two groups: the experimental group received peer tutoring along with regular instruction, and the control group received regular instruction with no peer tutoring. There were n1 = n2 = 30 children in each group. The Gates-MacGintie Reading Test was given to both groups before instruction began. For the experimental group, the mean score on the vocabulary portion of the test was x1 = 344.5, with sample standard deviation s1 = 49.1. For the control group, the mean score on the same test was x2 = 353.8, with sample standard deviation s2 = 50.5. Use a 5% level of significance to test the hypothesis that there was no difference in the vocabulary scores of the two groups before the instruction began. (a) What is the level of significance? (b) What is the value of the…arrow_forwardIn the journal Mental Retardation, an article reported the results of a peer tutoring program to help mildly mentally retarded children learn to read. In the experiment, the mildly retarded children were randomly divided into two groups: the experimental group received peer tutoring along with regular instruction, and the control group received regular instruction with no peer tutoring. There were n1 = n2 = 30 children in each group. The Gates-MacGintie Reading Test was given to both groups before instruction began. For the experimental group, the mean score on the vocabulary portion of the test was x1 = 344.5, with sample standard deviation s1 = 49.7. For the control group, the mean score on the same test was x2 = 354.0, with sample standard deviation s2 = 50.5. Use a 5% level of significance to test the hypothesis that there was no difference in the vocabulary scores of the two groups before the instruction began. (a) What is the level of significance? What is the value of the…arrow_forwardConsider the following actual data from a study by Lyon and Greenberg (1991). The first factor in their factorial ANOVA was family background; female participants were classified into two groups (Group 1: codependent, women with an alcoholic parent; Group 2: non-codependent, women with nonalcoholic parents). Members of these two groups were randomly assigned to one of two conditions; they were asked to donate time to help a man who was described to them as either Mr. Wrong (exploitative, selfish, and dishonest) or Mr. Right (nurturant, helpful). The researchers predicted that women from a non-codependent/nonalcoholic family background would be more helpful to a person described as nurturant and helpful, whereas women from a codependent/alcoholic family background would be more helpful to a person described as needy, exploitative, and selfish. The table of means below represents the amount of time donated in minutes in each of the four cells of this 2 × 2 factorial design. In each cell,…arrow_forward
- The following is an abstract from the journal Exceptional Children (O’Connor, White, & Swanson, 2007): Abstract: This research evaluated two methods to improve the reading fluency of struggling readers. Poor readers in grades 2 and 4 with (n = 17) and without (n = 20) learning disabilities were randomly assigned to one of two fluency practice variations or to a control group. Students in the treatments practiced reading aloud under repeated or continuous reading conditions with an adult listener in 15-min sessions, 3 days per week for 14 weeks. For students in the treatment conditions, growth curve analyses revealed significant differences in fluency and reading comprehension over students in the control. We found no significant differences between practice conditions. Consider the following elements in this study: (1) poor readers (2) students in grades 2 and 4 (3) students with and without learning disabilities (4) reading aloud with an adult listener or not (5) repeated or…arrow_forwardA study was conducted to explore workplace bullying in a community NHS trust. Staff were asked about whether workplace bullying had affected their working environment (Quine L, BMJ 1999; 318: 228-229). Those who had been bullied had lower levels of job satisfaction (mean 10.5 [SD 2.7] vs 12.2 [2.3], P<0.001) and higher levels of job-induced stress (mean 22.5 [SD 6.1] v 16.9 [5.8], P<0.001) than those who had not been bullied. Based on the above info, Select which of the following statement(s) you believe to be true You CAN SELECT MORE THAN 1. a. The P value for the comparison of job-induced stress was less than 0.001. This means that we cannot reject the null hypothesis at the 5% level of significance. b. P < 0.001 means that there is a less than 1 in 1000 chance that we would have obtained these results, or more extreme results, if the alternative hypothesis was true. c. There is a significant difference in the levels of job satisfaction between…arrow_forwardDo well-rounded people get fewer colds? A study on the Chronicle of Higher Education was conducted by scientist at Carnegie Mellon University, the University of Pittsburgh and the University of Virginia. They found that people who have only a few social outlets get more colds than those who are involved in a variety of social activities. Suppose that of the 276 healthy men and women tested, n1=96 had only a few social outlets and n2=105 were busy with six or more activities. When these people were exposed to a cold virus, the following results were observed: Construct a 99% confidence interval for the difference in the two population proportions.arrow_forward
- In a study designed to test the effectiveness of hypnosis in reducing pain a research team looked at responses from 8 randomly selected patients before and after hypnosis. The raw data are found in Table 1. Let ? = 0.01 Table 1: Perceived pain levels pre and post hypnosis for 8 subjects Pre 9.6 11.3 10.6 8.5 9.8 12.8 10.8 12.2 Post 9.3 11.0 8.5 10.0 10.2 9.4 8.9 11.5 Diff -0.3 -0.3 -2.1 1.5 0.4 -3.4 -1.9 -0.7 E) The point estimate for the true standard deviation of the effect that hypnosis has on pain perception is: Note: round your answer to 3 decimal precision G) The test statistic for this data set is: Note: Round your answer to the nearest hundredth.arrow_forward19. A local brewery produces three premium lagers named Half Pint, XXX, and Dark Knight. Of its premium lagers, the brewery bottles 40% Half Pint, 40% XXX, and 20% Dark Knight. In a marketing test of a sample of 80 consumers, 26 preferred the Half Pint lager, 42 preferred the XXX lager, and 12 preferred the Dark Night lager. Using a chi-square goodness-of-fit test, test whether the production of the premium lagers matches these consumer preferences using a .05 level of significance. 19. Step 1: Which of the following is the correct set of hypotheses?A. H0: The preferences will not match production (40% Half Pint, 40% XXX, 20% Dark Knight); and H1: The preferences will match production B. H0: \mu_{1}μ1 = \mu_{2}μ2 = \mu_{3}μ3; and H1: At least one of the categories will be different than the others C. H0: The preferences will match production (40% Half Pint, 40% XXX, 20% Dark Knight); and H1: The preferences will not match production 19b. Step 2: Compute the df and locate the…arrow_forward19. A local brewery produces three premium lagers named Half Pint, XXX, and Dark Knight. Of its premium lagers, the brewery bottles 40% Half Pint, 40% XXX, and 20% Dark Knight. In a marketing test of a sample of 80 consumers, 26 preferred the Half Pint lager, 42 preferred the XXX lager, and 12 preferred the Dark Night lager. Using a chi-square goodness-of-fit test, test whether the production of the premium lagers matches these consumer preferences using a .05 level of significance. 19. Step 3: Compute the test statistic -- Chi-square χ2 = (use 2 decimal places) _____________ Step 4: Decision and Conclusions 19. Step 4: Decision: A. Reject H0 B. Retain H0 19. Step 5: Conclusion: Did the production of the premium lagers match consumer preferences? A. Yes. The observed frequencies did not differ from the expected frequencies. B. No. The observed frequencies differed from the expected frequencies.arrow_forward
 Holt Mcdougal Larson Pre-algebra: Student Edition...AlgebraISBN:9780547587776Author:HOLT MCDOUGALPublisher:HOLT MCDOUGAL