
Introductory Statistics (10th Edition)
10th Edition
ISBN: 9780321989178
Author: Neil A. Weiss
Publisher: PEARSON
expand_more
expand_more
format_list_bulleted
Concept explainers
Videos
Textbook Question
Chapter 16.4, Problem 97E
In Exercises 16.94-16.99, use Procedure 16.2 on page 721 to perform a Tukey multiple comparison at the specified family confidence level.
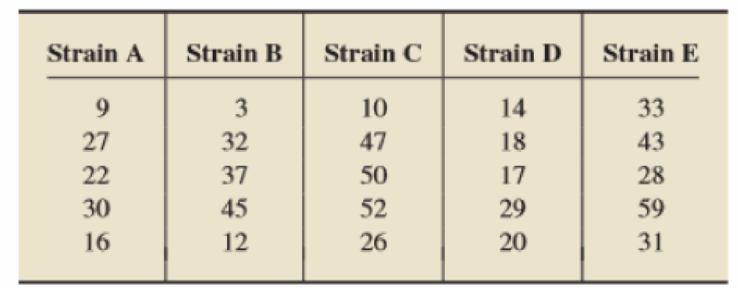
16.97 Staph Infections. Following are the data from Exercise 16.51 on bacteria counts, in millions, for different cases from each of five strains of cultured Staphylococcus aureus.
- a. Use a 95% family confidence level.
- b. Without doing any further work or referring to Exercise 16.51, decide at the 5% significance level whether the data provide sufficient evidence to conclude that a difference exists in mean bacteria counts among the live strains of Staphylococcus aureus. Explain your reasoning.
Expert Solution & Answer
Want to see the full answer?
Check out a sample textbook solution
Students have asked these similar questions
A poll conducted in January 2020 surveyed likely democrat primary voters about who they would vote for in the primary election in 2020 and found the following results for the top 4 candidates:
Joe Biden: 18%
Bernie Sanders: 17%
Elizabeth Warren: 16%
Pete Buttigieg: 14%
With a margin of error (AKA a 95% confidence interval) of ±4.1%. From a statistical standpoint, who would likely win the democrat primary if it was held on the day of the survey?
The figure to the right shows the results of a survey in which
1005
adults from Country A,
1023
adults from Country B,
995
adults from Country C,
1020
adults from Country D, and
1012
adults from Country E were asked whether national identity is strongly tied to birthplace.
Country A37%22%27%49%Country BCountry CCountry DCountry E10%
Construct a
99%
confidence interval for the population proportion of adults who say national identity is strongly tied to birthplace for each country listed.
The
99%
confidence interval for the proportion of adults from Country B who say national identity is strongly tied to birthplace is
enter your response here
,enter your response here
.
(Round to three decimal places as needed.)
The figure to the right shows the results of a survey in which
1005
adults from Country A,
1023
adults from Country B,
995
adults from Country C,
1020
adults from Country D, and
1012
adults from Country E were asked whether national identity is strongly tied to birthplace.
Country A37%22%27%49%Country BCountry CCountry DCountry E10%
Construct a
99%
confidence interval for the population proportion of adults who say national identity is strongly tied to birthplace for each country listed.
Question content area bottom
Part 1
The
99%
confidence interval for the proportion of adults from Country A who say national identity is strongly tied to birthplace is
(enter your response here
,enter your response here
).
(Round to three decimal places as needed.)
Chapter 16 Solutions
Introductory Statistics (10th Edition)
Ch. 16.1 - How do we identify an F-distribution and its...Ch. 16.1 - How many degrees of freedom does an F-curve have?...Ch. 16.1 - What symbol is used to denote the F-value having...Ch. 16.1 - Using the F-notation, identify the F-value having...Ch. 16.1 - An F-curve has df = (12, 7). What is the number of...Ch. 16.1 - An F-curve has df = (8, 19). What is the number of...Ch. 16.1 - In Exercises 16.716.10, use Table VIII in Appendix...Ch. 16.1 - Prob. 8ECh. 16.1 - Prob. 9ECh. 16.1 - Prob. 10E
Ch. 16.2 - One-way ANOVA is a procedure for comparing the...Ch. 16.2 - If we define s=MSE, of which parameter is s an...Ch. 16.2 - Explain the reason for the word variance in the...Ch. 16.2 - For a one-way ANOVA test, suppose that, in...Ch. 16.2 - Regarding one-way ANOVA, fill in the blanks in...Ch. 16.2 - Regarding one-way ANOVA, fill in the blanks in...Ch. 16.2 - Regarding one-way ANOVA, fill in the blanks in...Ch. 16.2 - Explain the logic behind one-way ANOVA.Ch. 16.2 - What does the term one-way signify in the phrase...Ch. 16.2 - Figure 16.6 shows side-by-side boxplots of...Ch. 16.2 - Figure 16.7 shows side-by-side boxplots of...Ch. 16.2 - Discuss two methods for checking the assumptions...Ch. 16.2 - In one-way ANOVA, what is the residual of an...Ch. 16.2 - In Exercises 16.24-16.29, we have provided data...Ch. 16.2 - In Exercises 16.24-16.29. we have provided data...Ch. 16.2 - In Exercises 16.24-16.29, we have provided data...Ch. 16.2 - In Exercises 16.24-16.29, we have provided data...Ch. 16.2 - In Exercises 16.24-16.29, we have provided data...Ch. 16.2 - In Exercises 16.24-16.29, we have provided data...Ch. 16.2 - Show that, for two populations, MSE=sp2, where is...Ch. 16.2 - Suppose that the variable under consideration is...Ch. 16.3 - Suppose that a one-way ANOVA is being performed to...Ch. 16.3 - We stated earlier that a one-way ANOVA test is...Ch. 16.3 - Following are the notations for the three sums of...Ch. 16.3 - State the one-way ANOVA identity, and interpret...Ch. 16.3 - True or false: If you know any two of the three...Ch. 16.3 - In each part, specify what type of analysis you...Ch. 16.3 - Prob. 38ECh. 16.3 - In Exercises 16.38-16.41, fill in the missing...Ch. 16.3 - In Exercises 16.38-16.41 fill in the missing...Ch. 16.3 - Prob. 41ECh. 16.3 - In Exercises 16.42-16.47. wt provide data from...Ch. 16.3 - In Exercises 16.42-16.47, we provide data from...Ch. 16.3 - Prob. 44ECh. 16.3 - Prob. 45ECh. 16.3 - Prob. 46ECh. 16.3 - Prob. 47ECh. 16.3 - Prob. 48ECh. 16.3 - Copepod Cuisine. Copepods are tiny crustaceans...Ch. 16.3 - In Exercises 16.48-16.53, apply Procedure 16.1 on...Ch. 16.3 - Staph Infections. In the article Using EDE, ANOVA...Ch. 16.3 - Prob. 52ECh. 16.3 - Prob. 53ECh. 16.3 - Prob. 54ECh. 16.3 - Prob. 55ECh. 16.3 - In Exercises 16.54-16.59, use the technology of...Ch. 16.3 - Prob. 57ECh. 16.3 - In Exercises 16.54-16.59, use. the technology of...Ch. 16.3 - Prob. 59ECh. 16.3 - Prob. 60ECh. 16.3 - Prob. 61ECh. 16.3 - In Exercises 16.60-16.63, refer to the discussion...Ch. 16.3 - Starting Salaries. The National Association of...Ch. 16.3 - Working with Large Data Sets In Exercises...Ch. 16.3 - Working with Large Data Sets In Exercises...Ch. 16.3 - In Exercises 16.64-16.72, use the technology of...Ch. 16.3 - In Exercises 16.6416.72, use the technology of...Ch. 16.3 - In Exercises 16.64-16.72, use the technology of...Ch. 16.3 - In Exercises 16.64-16.72, use the technology of...Ch. 16.3 - Prob. 70ECh. 16.3 - Prob. 71ECh. 16.3 - Prob. 72ECh. 16.3 - Prob. 73ECh. 16.3 - Prob. 74ECh. 16.3 - Prob. 75ECh. 16.4 - What is the purpose of doing a multiple...Ch. 16.4 - Fill in the blank: If a confidence interval for...Ch. 16.4 - Explain the difference between the family...Ch. 16.4 - Regarding family and individual confidence levels,...Ch. 16.4 - What is the name of the distribution on which the...Ch. 16.4 - The parameter v for the q-curve in a Tukey...Ch. 16.4 - Explain the essential difference between obtaining...Ch. 16.4 - Determine the following for a q-curve with...Ch. 16.4 - Determine the following for a q-curve with...Ch. 16.4 - Find the following for a q-curve with parameters K...Ch. 16.4 - Find the following for a q-curve with parameters K...Ch. 16.4 - Suppose that you conduct a one-way ANOVA test and...Ch. 16.4 - In Exercises 16.88-16.93, we repeal the data from...Ch. 16.4 - In Exercises 16.88-16.93, we repeat the data from...Ch. 16.4 - In Exercises 16.88-16.93, we repeat the data from...Ch. 16.4 - In Exercises 16.88-16.93, we repeat the data from...Ch. 16.4 - In Exercises 16.88-16.93, we repeat the data from...Ch. 16.4 - Prob. 93ECh. 16.4 - Prob. 94ECh. 16.4 - In Exercises 16.94-16.99, use Procedure 16.2 on...Ch. 16.4 - In Exercises 16.94-16.99, use Procedure 16.2 on...Ch. 16.4 - In Exercises 16.94-16.99, use Procedure 16.2 on...Ch. 16.4 - Prob. 98ECh. 16.4 - Prob. 99ECh. 16.4 - Prob. 100ECh. 16.4 - Prob. 101ECh. 16.4 - In Exercises 16.100-16.105, use the technology of...Ch. 16.4 - Prob. 103ECh. 16.4 - Prob. 104ECh. 16.4 - Prob. 105ECh. 16.4 - In Exercises 16.106-16.109, use Procedure 10.2 on...Ch. 16.4 - Prob. 107ECh. 16.4 - Prob. 108ECh. 16.4 - Prob. 109ECh. 16.4 - Prob. 110ECh. 16.4 - In Exercises 16.110-16.118, we repeat information...Ch. 16.4 - Prob. 112ECh. 16.4 - Prob. 113ECh. 16.4 - Prob. 114ECh. 16.4 - In Exercises 16.110-16.118, we repeat information...Ch. 16.4 - Prob. 116ECh. 16.4 - Prob. 117ECh. 16.4 - In Exercises 16.110-16.16.118, we repeat...Ch. 16.4 - Explain why the family confidence level, not the...Ch. 16.4 - Prob. 120ECh. 16.4 - Energy Consumption. Apply Table 16.11 on page 723...Ch. 16.5 - Prob. 122ECh. 16.5 - Prob. 123ECh. 16.5 - Prob. 124ECh. 16.5 - Prob. 125ECh. 16.5 - Prob. 126ECh. 16.5 - The measure of total variation of all the ranks is...Ch. 16.5 - Regarding a Kruskal-Wallis test, fill in the...Ch. 16.5 - Prob. 129ECh. 16.5 - Prob. 130ECh. 16.5 - In each of Exercises 16.130-16.133, suppose that...Ch. 16.5 - Prob. 132ECh. 16.5 - Prob. 133ECh. 16.5 - Prob. 134ECh. 16.5 - Prob. 135ECh. 16.5 - Prob. 136ECh. 16.5 - Prob. 137ECh. 16.5 - Prob. 138ECh. 16.5 - Prob. 139ECh. 16.5 - Prob. 140ECh. 16.5 - Prob. 141ECh. 16.5 - Prob. 142ECh. 16.5 - Prob. 143ECh. 16.5 - Prob. 144ECh. 16.5 - In Exercises 16.144-16.149, perform a...Ch. 16.5 - In Exercises 16.144-16.149, perform a...Ch. 16.5 - In Exercises 16.144-16.149, perform a...Ch. 16.5 - Prob. 148ECh. 16.5 - Prob. 149ECh. 16.5 - Prob. 150ECh. 16.5 - Prob. 151ECh. 16.5 - Prob. 152ECh. 16.5 - Prob. 153ECh. 16.5 - Prob. 154ECh. 16.5 - Prob. 155ECh. 16.5 - Prob. 156ECh. 16.5 - Prob. 157ECh. 16.5 - Prob. 158ECh. 16.5 - Prob. 159ECh. 16.5 - Prob. 160ECh. 16.5 - Prob. 161ECh. 16.5 - Prob. 162ECh. 16.5 - Prob. 163ECh. 16.5 - Prob. 164ECh. 16.5 - Prob. 165ECh. 16.5 - Prob. 166ECh. 16.5 - Prob. 167ECh. 16 - For what is one-way ANOVA used?Ch. 16 - State the four assumptions for one-way ANOVA, and...Ch. 16 - On what distribution does one-way ANOVA rely?Ch. 16 - Suppose that you want to compare the means of...Ch. 16 - Prob. 5RPCh. 16 - In one-way ANOVA, a. list and interpret the three...Ch. 16 - Prob. 7RPCh. 16 - Prob. 8RPCh. 16 - Prob. 9RPCh. 16 - Prob. 10RPCh. 16 - Prob. 11RPCh. 16 - Suppose that you want to compare the means of...Ch. 16 - Prob. 13RPCh. 16 - Prob. 14RPCh. 16 - Prob. 15RPCh. 16 - Prob. 16RPCh. 16 - In Problems 17-21, consider an F-curve with df =...Ch. 16 - Prob. 18RPCh. 16 - Prob. 19RPCh. 16 - Prob. 20RPCh. 16 - Prob. 21RPCh. 16 - Consider a q -curve with parameters 3 and 14. a....Ch. 16 - Consider the following hypothetical samples. A B C...Ch. 16 - Losses to Robbery. The Federal Bureau of...Ch. 16 - Prob. 25RPCh. 16 - Prob. 26RPCh. 16 - Prob. 27RPCh. 16 - Losses to Robbery. Refer to Problem 24. a. At the...Ch. 16 - Foot-pressure Angle. Genu valgum, commonly known...Ch. 16 - Prob. 30RPCh. 16 - Prob. 31RPCh. 16 - Prob. 32RPCh. 16 - In Problems 3234, use the technology of your...Ch. 16 - Prob. 34RPCh. 16 - Prob. 35RPCh. 16 - In Problems 3537, refer to the specified problem...Ch. 16 - Prob. 37RPCh. 16 - Recall from Chapter 1 (see page 34) that the Focus...Ch. 16 - SELF-PERCEPTION AND PHYSICAL ACTIVITY As you...
Knowledge Booster


Learn more about
Need a deep-dive on the concept behind this application? Look no further. Learn more about this topic, statistics and related others by exploring similar questions and additional content below.Similar questions
- What is meant by the sample space of an experiment?arrow_forwardIn Exercises 1–5, use the following survey results: Randomly selected subjects were asked if they were aware that the Earth has lost half of its wildlife population during the past 50 years. Among 1121 women, 23% said that they were aware. Among 1084 men, 26% said that they were aware (based on data from a Harris poll). Biodiversity When using the given sample data to construct a 95% confidence interval estimate of the difference between the two population proportions, the result of (−0.0659, 0.00591) is obtained from technology. a. Express that confidence interval in a format that uses the symbol <. b. What feature of the confidence interval is a basis for deciding whether there is a significant difference between the proportion of women aware of the statement and the proportion of men who are aware?arrow_forwardAfter Texas A&M lost again to their rival, the University of Texas, in a football game, the A&M Alumni association decided to conduct a survey to see who wanted to fire the head football coach. Let p represent the proportion of all alumni who favor firing the coach. To guarantee an estimate that is within 0.05 of p at the 95% confidence level, which of the following is the smallest sample size needed? a 269 b 1436 c 385 d 601 e 421arrow_forward
- In a survey of 500 students, 180 students said that they prefer classes on Mondays and Wednesdays rather than on Tuesdays and Thursdays. Using a 95% confidence interval, answer the following questions. a. What is the margin of error for this study? b. Construct a 95% confidence interval that estimates the proportion of students that prefer classes on Mondays and Wednesdays.arrow_forward1. A recent survey showed that from a sample of 500 packages delivered by a Postal Service, 480were delivered on time. a) Construct a 95% confidence interval for the proportion of all packages that are deliveredon time by the Postal Service.arrow_forwardThe figure to the right shows the results of a survey in which 1015 adults from Country A, 1018 adults from Country B, 1020 adults from Country C, 1014 adults from Country D, and 1024 adults from Country E were asked whether national identity is strongly tied to birthplace. Country A 34% Country B 19% Country C 23% Country D 48% Country E 12% Construct a 99% confidence interval for the population proportion of adults who say national identity is strongly tied to birthplace for each country listed.arrow_forward
- Suppose in a recent poll of 1250 randomly selected Californians who took vacations, 132 of them reported visiting theme parks. Use the four-step process to find a 95% confidence interval for the proportion of Californians who visit a theme park while on vacation. Round final calculations to the nearest tenth of a percent.arrow_forwardSuppose that a safety group surveyed 1,100 drivers. Among those surveyed, 65% said that careless or aggressive driving was the biggest threat on the road, and 25% said that cell phone usage by other drivers was the driving behavior that annoyed them the most. Based on these data and assuming that the sample was a simple random sample, construct and interpret a 95% confidence interval estimate for the true proportion in the population of all drivers who are annoyed by cell phone users. The confidence interval estimate is ??––––––??> (Round to three decimal places as needed. Use ascending order.) Interpret the confidence interval estimate. A. There is a 0.95 probability that the population proportion of drivers who are annoyed by cell phone users is in the interval. B. There is 95% confidence that the population proportion of drivers who are annoyed by cell phone users is in the interval. C. There is 95% confidence that the population proportion…arrow_forwardA study, which randomly surveyed 3,700 households and drew on this information from the IRS, found that 79% of households have conducted at least one IRA rollover from an employer-sponsored retirement plan. Suppose a recent random sample of 90 households in a certain county was taken and respondents were asked whether they had ever funded an IRA account with a rollover from an employer-sponsored retirement plan. Based on the sample data below, can you conclude at the 0.10 level of significance that the proportion of households in the county that have funded an IRA with a rollover is different from the proportion for all households reported in the study? 77 respondents said they had funded an account; 13 respondents said they had notarrow_forward
- Refer to the accompanying data set of 20 randomly selected presidents. Treat the data as a sample and find the proportion of presidents who were taller than their opponents. Use that result to construct a 95% confidence interval estimate of the population percentage. Based on the result, does it appear that greater height is an advantage for presidential candidates? Why or why not? Construct a 95% confidence interval estimate of the percentage of presidents who were taller than their opponents. PRESIDENT HEIGHT HEIGHT OPPMcKinley 170 178Lincoln 193 188Reagan 185 177Taft 182 178Harrison 173 168Van Buren 168 180Harding 183 178Eisenhower 179 178Taylor 173 174Garfield 183 187J. Kennedy 183 182Harrison 168 180J. Q. Adams 171 191Clinton 188 188Nixon 182 180Johnson 192 180Hoover 182 180T. Roosevelt 178 175Buchanan 183 175Polk 173 185arrow_forwardSuppose that a safety group surveyed 800 drivers. Among those surveyed, 83% said that careless or aggressive driving was the biggest threat on the road, and 34% said that cell phone usage by other drivers was the driving behavior that annoyed them the most. Based on these data and assuming that the sample was a simple random sample, construct and interpret a 95% confidence interval estimate for the true proportion in the population of all drivers who are annoyed by cell phone users. The confidence interval estimate is ??––––––?? (Round to three decimal places as needed. Use ascending order.) Interpret the confidence interval estimate. A. There is a 0.95 probability that the population proportion of drivers who are annoyed by cell phone users is in the interval. B. There is 95% confidence that the population proportion of drivers who are annoyed by cell phone users is in the interval. C. There is a 0.95 probability that the sample proportion of drivers…arrow_forwardRefer to the data set of 20 randomly selected presidents given below. Treat the data as a sample and find the proportion of presidents who were taller than their opponents. Use that result to construct a 95% confidence interval estimate of the population percentage. Based on the result, does it appear that greater height is an advantage for presidential candidates? Why or why not? Jefferson 189 170 Hoover 182 180 Harding 183 178 Coolidge 178 180 Polk 173 185 McKinley 170 178 Taft 182 178 J. Kennedy 183 182 T. Roosevelt 178 175 Wilson 180 182 G. W. Bush 183 185 Jackson 185 171 Clinton 188 188 J. Q. Adams 171 191 J. Adams 170 189 Reagan 185 177 Lincoln 193 188 Truman 175 173 Cleveland 180 180 Garfield 183 187 Construct a 95% confidence interval estimate of the percentage of presidents who were taller than their opponents. If greater height was an advantage. then taller candidates should have won ___________ 50% of the elections. In this…arrow_forward
arrow_back_ios
arrow_forward_ios
Recommended textbooks for you
 College Algebra (MindTap Course List)AlgebraISBN:9781305652231Author:R. David Gustafson, Jeff HughesPublisher:Cengage Learning
College Algebra (MindTap Course List)
Algebra
ISBN:9781305652231
Author:R. David Gustafson, Jeff Hughes
Publisher:Cengage Learning
Statistics 4.1 Point Estimators; Author: Dr. Jack L. Jackson II;https://www.youtube.com/watch?v=2MrI0J8XCEE;License: Standard YouTube License, CC-BY
Statistics 101: Point Estimators; Author: Brandon Foltz;https://www.youtube.com/watch?v=4v41z3HwLaM;License: Standard YouTube License, CC-BY
Central limit theorem; Author: 365 Data Science;https://www.youtube.com/watch?v=b5xQmk9veZ4;License: Standard YouTube License, CC-BY
Point Estimate Definition & Example; Author: Prof. Essa;https://www.youtube.com/watch?v=OTVwtvQmSn0;License: Standard Youtube License
Point Estimation; Author: Vamsidhar Ambatipudi;https://www.youtube.com/watch?v=flqhlM2bZWc;License: Standard Youtube License