
Concept explainers
Videos
Staph Infections. In the article “Using EDE, ANOVA and Regression to Optimize Some Microbiology Data” (Journal of Statistics Education, Vol. 12, No. 2, online). N. Binnie analyzed bacteria- culture data collected by G. Cooper at the Auckland University of Technology. Five strains of cultured Staphylococcus aureus— bacteria that cause staph infections—were observed for 24 hours at 27°C. The following table reports bacteria counts, in millions, for different cases from each of the five strains.
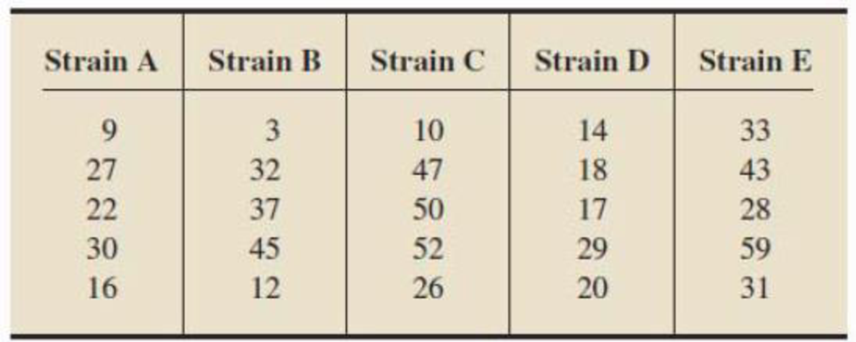
At the 5% significance level, do the data provide sufficient evidence to conclude that a difference exists in mean bacteria counts among the five strains of Staphylococcus aureus? (Note: T1 = 104, T2 = 129, T3 = 185, T4 = 98, T5 = 194, and
Want to see the full answer?
Check out a sample textbook solution
Chapter 16 Solutions
Introductory Statistics (10th Edition)


- The average asking rent for 10 markets, and the corresponding monthly mortgage on the median priced home (including taxes and insurance) for 10 cities are given in Rent ($) Mortgage ($) City 1 840 539 City 2 1062 1002 City 3 823 626 City 4 779 711 City 5 796 655 City 6 1071 977 City 7 953 776 City 8 851 695 City 9 762 651 City 10 723 654 What is the simple linear regression model to predict the monthly mortgage on the median priced home, using average asking rent? Fill in the coefficient for the LINEAR independent variable (keep 2 decimal points).arrow_forwardA researcher notes that, in a certain region, a disproportionate number of software millionaires were born around the year 1955. Is this a coincidence, or does birth year matter when gauging whether a software founder will besuccessful? The researcher investigated this question by analyzing the data shown in the accompanying table. Complete parts a through c below. a. Find the coefficient of determination for the simple linear regression model relating number (y) of software millionaire birthdays in a decade to total number (x) of births in the region. Interpret the result. The coefficient of determination is 1.___? (Round to three decimal places as needed.) This value indicates that 2.____ of the sample variation in the number of software millionaire birthdays is explained by the linear relationship with the total number of births in the region. (Round to one decimal place as needed.) b. Find the coefficient of determination for the simple linear regression model…arrow_forwardBill is the office manager for a group of financial advisors who provide financial services for individual clients. She would like to investigate whether a relationship exists between the number of presentations made to prospective clients in a month and the number of new clients per month. The following table shows the number of presentations and corresponding new clients for a random sample of six employees. Employee Presentations New Clients 1 2 1 2 8 2 3 9 4 4 10 3 5 11 5 6 12 6 Bill would like to use simple regression analysis to estimate the number of new clients per month based on the number of presentations made by the employee per month. The average number of new clients per month for an employee who made 20 presentations per month is ________. 5.02 5.45 3.43 8.69arrow_forward
- The Update to the Task Force Report on Blood Pressure Control in Children [12] reported the observed 90th per-centile of SBP in single years of age from age 1 to 17 based on prior studies. The data for boys of average height are given in Table 11.18. Suppose we seek a more efficient way to display the data and choose linear regression to accomplish this task. age sbp 1 99 2 102 3 105 4 107 5 108 6 110 7 111 8 112 9 114 10 115 11 117 12 120 13 122 14 125 15 127 16 130 17 132 Do you think the linear regression provides a good fit to the data? Why or why not? Use residual analysis to justify your answer. Am I supposed to run a residual plot and QQ-plot for this question?arrow_forwardIf there is no significant correlation between the response and explanatory variables, would the slope of the regression line be (a) positive (b) negative (c) zero?arrow_forwardProtein Content of Wheat. In their text, Methods of Correlation and Regression Analysis (New York: Wiley, 1959), M. Ezekiel and K. Fox present, for 20 batches of wheat, data on protein content and proportion of (hard, dark) vitreous kernels, as seen in the following table. Protein content is found by expensive chemical analysis,whereas proportion of vitreous kernels is found by visual inspection. To provide an inexpensive way for predicting protein content, we want to obtain an appropriate regression equation for relating protein content to proportion of vitreous kernels. Use Procedure B.1 on page B-13 to determine a suitable regression equation.arrow_forward
- Protein Content of Wheat. In their text, Methods of Correlation and Regression Analysis (New York: Wiley, 1959), M. Ezekiel and K. Fox present, for 20 batches of wheat, data on protein content and proportion of (hard, dark) vitreous kernels, as seen in the following table. Protein content is found by expensive chemical analysis,whereas proportion of vitreous kernels is found by visual inspection. To provide an inexpensive way for predicting protein content, we want to obtain an appropriate regression equation for relating protein content to proportion of vitreous kernels.arrow_forwardThe owner of Maumee Ford-Mercury-Volvo wants to study the relationship between the age of a car and its selling price. Listed below is a random sample of 12 used cars sold at the dealership during the last year. Car Age Price 1 10 10.8 2 6 9.1 3 12 4.3 4 16 5 5 8 5.1 6 7 11.5 7 9 11.6 8 13 8 9 12 8 10 16 3.9 11 4 12.8 12 4 11.1 Determine the regression equation. (Negative value should be indicated by a minus sign. Round your answers to 3 decimal places.) a= b= Estimate the selling price of a 9-year-old car (in $000). (Round your answer to 3 decimal places.) So for each additional year, the car price decreases ____ in value. Interpret the regression equation (in dollars). (Round your answer to the nearest dollar amount.)arrow_forwarda) Calculate the least square regression line for X on Y of the given data?b) Calculate the coefficient of correlation of the given date? Interpret the value of the coefficient?arrow_forward
- In order to determine a realistic price for a new product that a company wants to market the company’s research department selected 10 sites thought to have essentially identical sales potential and offered the product in each at a different price. The resulting sales are recorded in the accompanying table: Price ($) Sales ($1,000s) 15.00 15 15.50 14 16.00 16 16.50 9 17.00 12 17.50 10 18.00 8 18.50 9 19.00 6 19.50 5 c). Find the equation of the sample regression line using Minitab. d). Interpret the meaning of the coefficients of the equation of the sample regression line.arrow_forwardSarah is the office manager for a group of financial advisors who provide financial services for individual clients. She would like to investigate whether a relationship exists between the number of presentations made to prospective clients in a month and the number of new clients per month. The following table shows the number of presentations and corresponding new clients for a random sample of six employees. Employee Presentations New Clients 1 7 2 2 9 3 3 9 4 4 10 3 5 11 5 6 12 3 Sarah would like to use simple regression analysis to estimate the number of new clients per month based on the number of presentations made by the employee per month. The expected number of new clients per month for an employee who made 10 presentations per month is ________. 2.3982 1.6753 3.0521 3.4348arrow_forward. A professor at the University of Alabama was interested in evaluating the relationship between family support and delinquency. Using data collected on 4545 families, the researcher used regression to analyze the relationship. The results are presented below. Variables Entered/Removeda Model Variables Entered Variables Removed Method 1 Family supportb . Enter a. Dependent Variable: Delinquency b. All requested variables entered. Model Summary Model R R Square Adjusted R Square Std. Error of the Estimate 1 .249a .062 .062 1.59168 a. Predictors: (Constant), Family support ANOVAa Model Sum of Squares df Mean Square F Sig. 1 Regression 759.204 1 759.204 299.671 <.001b Residual 11479.107 4531 2.533 Total 12238.311 4532 a. Dependent Variable: Delinquency b. Predictors: (Constant), Family support…arrow_forward
 MATLAB: An Introduction with ApplicationsStatisticsISBN:9781119256830Author:Amos GilatPublisher:John Wiley & Sons Inc
 Probability and Statistics for Engineering and th...StatisticsISBN:9781305251809Author:Jay L. DevorePublisher:Cengage Learning
 Statistics for The Behavioral Sciences (MindTap C...StatisticsISBN:9781305504912Author:Frederick J Gravetter, Larry B. WallnauPublisher:Cengage Learning
 Elementary Statistics: Picturing the World (7th E...StatisticsISBN:9780134683416Author:Ron Larson, Betsy FarberPublisher:PEARSON
 The Basic Practice of StatisticsStatisticsISBN:9781319042578Author:David S. Moore, William I. Notz, Michael A. FlignerPublisher:W. H. Freeman
 Introduction to the Practice of StatisticsStatisticsISBN:9781319013387Author:David S. Moore, George P. McCabe, Bruce A. CraigPublisher:W. H. Freeman