
Videos
Lean accounting. Reliable Security Devices (RSD) has introduced a just-in-time production process and is considering the adoption of lean accounting principles to support its new production philosophy. The company has two product lines: Mechanical Devices and Electronic Devices. Two individual products are made in each line. Product-line
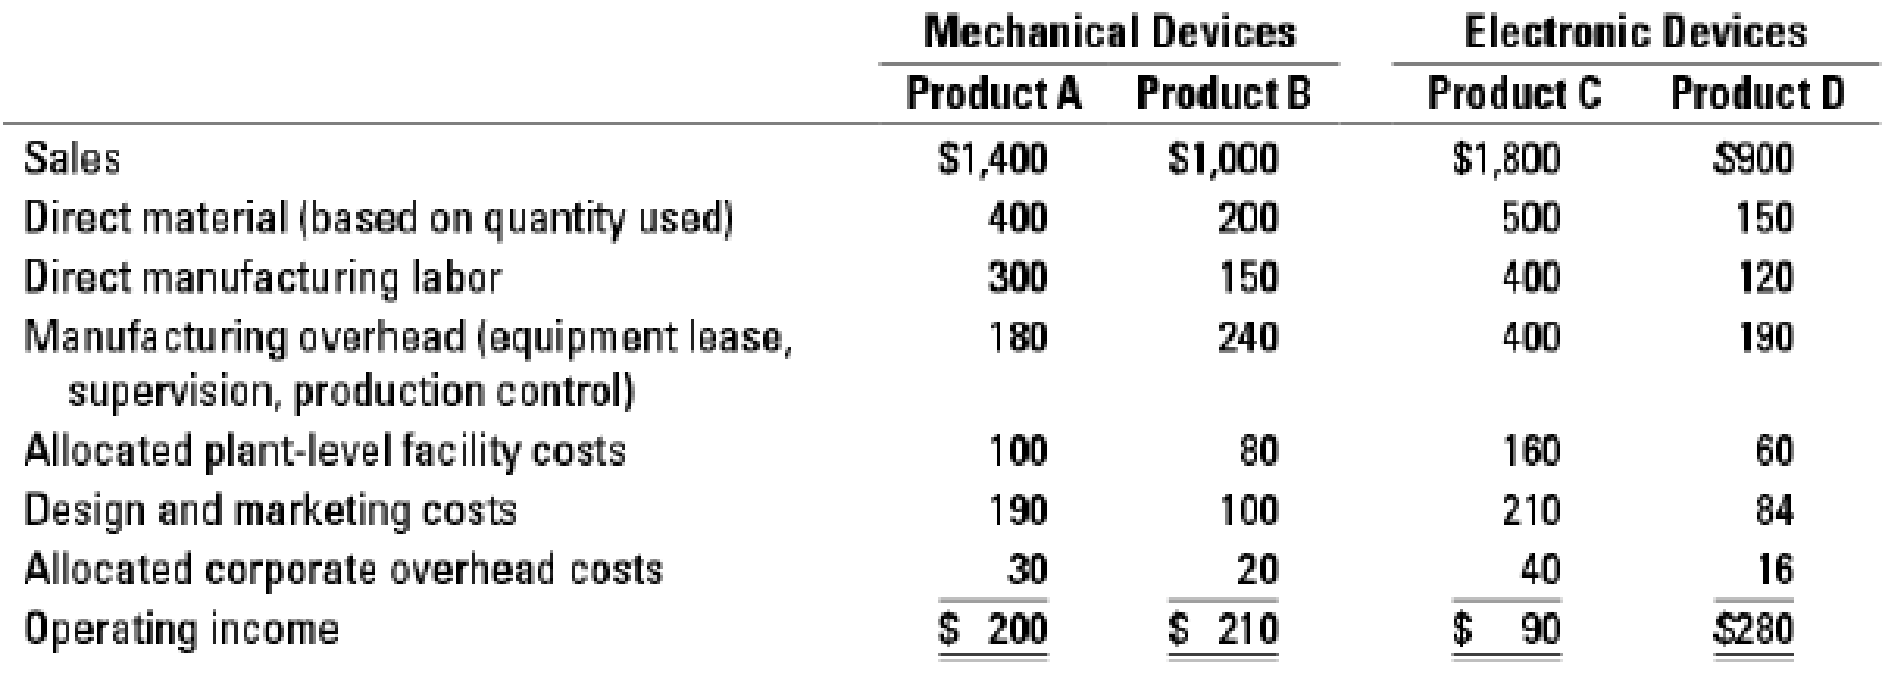
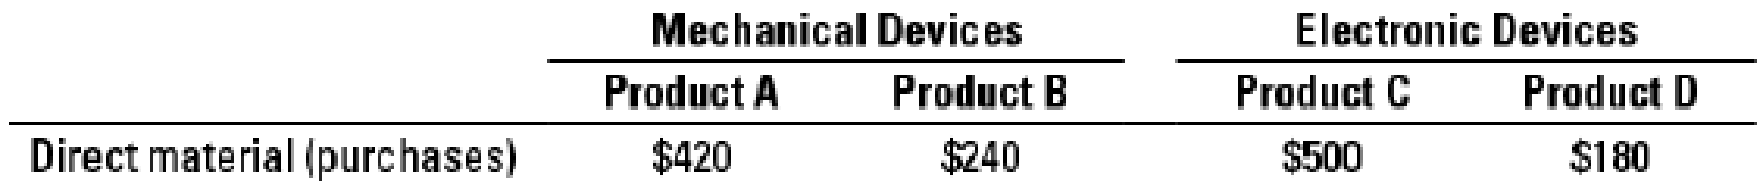
RSD has determined that each of the two product lines represents a distinct value stream. It has also determined that out of the $400,000 ($100,000 + $80,000 + $160,000 + $60,000) plant-level facility costs, product A occupies 22% of the plant’s square footage, product B occupies 18%, product C occupies 36%, and product D occupies 14%. The remaining 10% of square footage is not being used. Finally, RSD has decided that in order to identify inefficiencies, direct material should be expensed in the period it is purchased, rather than when the material is used. According to purchasing records, direct material purchase costs during the period were as follows:
- 1. What are the cost objects in RSD’s lean accounting system?
Required
- 2. Compute operating income for the cost objects identified in requirement 1 using lean accounting principles. What would you compare this operating income against? Comment on your results.
Want to see the full answer?
Check out a sample textbook solution
Chapter 20 Solutions
COST ACCT-W/ACCESS >C< NON-MAJORS


- The management of Wheeler Company has decided to develop cost formulas for its major overhead activities. Wheeler uses a highly automated manufacturing process, and power costs are a significant manufacturing cost. Cost analysts have decided that power costs are mixed; thus, they must be broken into their fixed and variable elements so that the cost behavior of the power usage activity can be properly described. Machine hours have been selected as the activity driver for power costs. The following data for the past eight quarters have been collected: Required: 1. Prepare a scattergraph by plotting power costs against machine hours. Does the scatter-graph show a linear relationship between machine hours and power cost? 2. Using the high and low points, compute a power cost formula. 3. Use the method of least squares to compute a power cost formula. Evaluate the coefficient of determination. 4. Rerun the regression and drop the point (20,000; 26,000) as an outlier. Compare the results from this regression to those for the regression in Requirement 3. Which is better?arrow_forwardCommunication The controller of New Wave Sounds Inc. prepared the following product profitability report for management, using activity-based costing methods for allocating both the factory overhead and the marketing expenses. As such, the controller has confidence in the accuracy of this report. In addition, the controller interviewed the vice president of marketing, who provided the following insight into the companys three products: The home theater speakers are an older product that is highly recognized in the marketplace. The wireless speakers are a new product that was just recently launched. The wireless headphones are a new technology that has no competition in the marketplace, and it is hoped that they will become an important future addition to the companys product portfolio. Initial indications are that the product is well received by customers. The controller believes that the manufacturing costs for all three products are in line with expectations. Based on the information provided: 1. Calculate the ratio of gross profit to sales and the ratio of operating income to sales for each product. 2. Write a brief (one-page) memo using the product profitability report and the calculations in (a) to make recommendations to management with respect to strategies for the three products.arrow_forwardYoung Company is beginning operations and is considering three alternatives to allocate manufacturing overhead to individual units produced. Young can use a plantwide rate, departmental rates, or activity-based costing. Young will produce many types of products in its single plant, and not all products will be processed through all departments. In which one of the following independent situations would reported net income for the first year be the same regardless of which overhead allocation method had been selected? a. All production costs approach those costs that were budgeted. b. The sales mix does not vary from the mix that was budgeted. c. All manufacturing overhead is a fixed cost. d. All ending inventory balances are zero.arrow_forward
- Evans, Inc., has a unit-based costing system. Evanss Miami plant produces 10 different electronic products. The demand for each product is about the same. Although they differ in complexity, each product uses about the same labor time and materials. The plant has used direct labor hours for years to assign overhead to products. To help design engineers understand the assumed cost relationships, the Cost Accounting Department developed the following cost equation. (The equation describes the relationship between total manufacturing costs and direct labor hours; the equation is supported by a coefficient of determination of 60 percent.) Y=5,000,000+30X,whereX=directlaborhours The variable rate of 30 is broken down as follows: Because of competitive pressures, product engineering was given the charge to redesign products to reduce the total cost of manufacturing. Using the above cost relationships, product engineering adopted the strategy of redesigning to reduce direct labor content. As each design was completed, an engineering change order was cut, triggering a series of events such as design approval, vendor selection, bill of materials update, redrawing of schematic, test runs, changes in setup procedures, development of new inspection procedures, and so on. After one year of design changes, the normal volume of direct labor was reduced from 250,000 hours to 200,000 hours, with the same number of products being produced. Although each product differs in its labor content, the redesign efforts reduced the labor content for all products. On average, the labor content per unit of product dropped from 1.25 hours per unit to one hour per unit. Fixed overhead, however, increased from 5,000,000 to 6,600,000 per year. Suppose that a consultant was hired to explain the increase in fixed overhead costs. The consultants study revealed that the 30 per hour rate captured the unit-level variable costs; however, the cost behavior of other activities was quite different. For example, setting up equipment is a step-fixed cost, where each step is 2,000 setup hours, costing 90,000. The study also revealed that the cost of receiving goods is a function of the number of different components. This activity has a variable cost of 2,000 per component type and a fixed cost that follows a step-cost pattern. The step is defined by 20 components with a cost of 50,000 per step. Assume also that the consultant indicated that the design adopted by the engineers increased the demand for setups from 20,000 setup hours to 40,000 setup hours and the number of different components from 100 to 250. The demand for other non-unit-level activities remained unchanged. The consultant also recommended that management take a look at a rejected design for its products. This rejected design increased direct labor content from 250,000 hours to 260,000 hours, decreased the demand for setups from 20,000 hours to 10,000 hours, and decreased the demand for purchasing from 100 component types to 75 component types, while the demand for all other activities remained unchanged. Required: 1. Using normal volume, compute the manufacturing cost per labor hour before the year of design changes. What is the cost per unit of an average product? 2. Using normal volume after the one year of design changes, compute the manufacturing cost per hour. What is the cost per unit of an average product? 3. Before considering the consultants study, what do you think is the most likely explanation for the failure of the design changes to reduce manufacturing costs? Now use the information from the consultants study to explain the increase in the average cost per unit of product. What changes would you suggest to improve Evanss efforts to reduce costs? 4. Explain why the consultant recommended a second look at a rejected design. Provide computational support. What does this tell you about the strategic importance of cost management?arrow_forwardTom Young, vice president of Dunn Company (a producer of plastic products), has been supervising the implementation of an activity-based cost management system. One of Toms objectives is to improve process efficiency by improving the activities that define the processes. To illustrate the potential of the new system to the president, Tom has decided to focus on two processes: production and customer service. Within each process, one activity will be selected for improvement: molding for production and sustaining engineering for customer service. (Sustaining engineers are responsible for redesigning products based on customer needs and feedback.) Value-added standards are identified for each activity. For molding, the value-added standard calls for nine pounds per mold. (Although the products differ in shape and function, their size, as measured by weight, is uniform.) The value-added standard is based on the elimination of all waste due to defective molds (materials is by far the major cost for the molding activity). The standard price for molding is 15 per pound. For sustaining engineering, the standard is 60 percent of current practical activity capacity. This standard is based on the fact that about 40 percent of the complaints have to do with design features that could have been avoided or anticipated by the company. Current practical capacity (the first year) is defined by the following requirements: 18,000 engineering hours for each product group that has been on the market or in development for five years or less, and 7,200 hours per product group of more than five years. Four product groups have less than five years experience, and 10 product groups have more. There are 72 engineers, each paid a salary of 70,000. Each engineer can provide 2,000 hours of service per year. There are no other significant costs for the engineering activity. For the first year, actual pounds used for molding were 25 percent above the level called for by the value-added standard; engineering usage was 138,000 hours. There were 240,000 units of output produced. Tom and the operational managers have selected some improvement measures that promise to reduce non-value-added activity usage by 30 percent in the second year. Selected actual results achieved for the second year are as follows: The actual prices paid per pound and per engineering hour are identical to the standard or budgeted prices. Required: 1. For the first year, calculate the non-value-added usage and costs for molding and sustaining engineering. Also, calculate the cost of unused capacity for the engineering activity. 2. Using the targeted reduction, establish kaizen standards for molding and engineering (for the second year). 3. Using the kaizen standards prepared in Requirement 2, compute the second-year usage variances, expressed in both physical and financial measures, for molding and engineering. (For engineering, explain why it is necessary to compare actual resource usage with the kaizen standard.) Comment on the companys ability to achieve its targeted reductions. In particular, discuss what measures the company must take to capture any realized reductions in resource usage.arrow_forwardLarsen, Inc., produces two types of electronic parts and has provided the following data: There are four activities: machining, setting up, testing, and purchasing. Required: 1. Calculate the activity consumption ratios for each product. 2. Calculate the consumption ratios for the plantwide rate (direct labor hours). When compared with the activity ratios, what can you say about the relative accuracy of a plantwide rate? Which product is undercosted? 3. What if the machine hours were used for the plantwide rate? Would this remove the cost distortion of a plantwide rate?arrow_forward
- Reducir, Inc., produces two different types of hydraulic cylinders. Reducir produces a major subassembly for the cylinders in the Cutting and Welding Department. Other parts and the subassembly are then assembled in the Assembly Department. The activities, expected costs, and drivers associated with these two manufacturing processes are given below. Note: In the assembly process, the materials-handling activity is a function of product characteristics rather than batch activity. Other overhead activities, their costs, and drivers are listed below. Other production information concerning the two hydraulic cylinders is also provided: Required: 1. Using a plantwide rate based on machine hours, calculate the total overhead cost assigned to each product and the unit overhead cost. 2. Using activity rates, calculate the total overhead cost assigned to each product and the unit overhead cost. Comment on the accuracy of the plantwide rate. 3. Calculate the global consumption ratios. 4. Calculate the consumption ratios for welding and materials handling (Assembly) and show that two drivers, welding hours and number of parts, can be used to achieve the same ABC product costs calculated in Requirement 2. Explain the value of this simplification. 5. Calculate the consumption ratios for inspection and engineering, and show that the drivers for these two activities also duplicate the ABC product costs calculated in Requirement 2.arrow_forwardRandy Harris, controller, has been given the charge to implement an advanced cost management system. As part of this process, he needs to identify activity drivers for the activities of the firm. During the past four months, Randy has spent considerable effort identifying activities, their associated costs, and possible drivers for the activities costs. Initially, Randy made his selections based on his own judgment using his experience and input from employees who perform the activities. Later, he used regression analysis to confirm his judgment. Randy prefers to use one driver per activity, provided that an R2 of at least 80 percent can be produced. Otherwise, multiple drivers will be used, based on evidence provided by multiple regression analysis. For example, the activity of inspecting finished goods produced an R2 of less than 80 percent for any single activity driver. Randy believes, however, that a satisfactory cost formula can be developed using two activity drivers: the number of batches and the number of inspection hours. Data collected for a 14-month period are as follows: Required: 1. Calculate the cost formula for inspection costs using the two drivers, inspection hours and number of batches. Are both activity drivers useful? What does the R2 indicate about the formula? 2. Using the formula developed in Requirement 1, calculate the inspection cost when 300 inspection hours are used and 30 batches are produced. Prepare a 90 percent confidence interval for this prediction.arrow_forwardKagle design engineers are in the process of developing a new green product, one that will significantly reduce impact on the environment and yet still provide the desired customer functionality. Currently, two designs are being considered. The manager of Kagle has told the engineers that the cost for the new product cannot exceed 550 per unit (target cost). In the past, the Cost Accounting Department has given estimated costs using a unit-based system. At the request of the Engineering Department, Cost Accounting is providing both unit-and activity-based accounting information (made possible by a recent pilot study producing the activity-based data). Unit-based system: Variable conversion activity rate: 100 per direct labor hour Material usage rate: 20 per part ABC system: Labor usage: 15 per direct labor hour Material usage (direct materials): 20 per part Machining: 75 per machine hour Purchasing activity: 150 per purchase order Setup activity: 3,000 per setup hour Warranty activity: 500 per returned unit (usually requires extensive rework) Customer repair cost: 25 per repair hour (average) Required: 1. Select the lower-cost design using unit-based costing. Are logistical and post-purchase activities considered in this analysis? 2. Select the lower-cost design using ABC analysis. Explain why the analysis differs from the unit-based analysis. 3. What if the post-purchase cost was an environmental contaminant and amounted to 10 per unit for Design A and 40 per unit for Design B? Assume that the environmental cost is borne by society. Now which is the better design?arrow_forward
- The management of Hartman Company is trying to determine the amount of each of two products to produce over the coming planning period. The following information concerns labor availability, labor utilization, and product profitability: a. Develop a linear programming model of the Hartman Company problem. Solve the model to determine the optimal production quantities of products 1 and 2. b. In computing the profit contribution per unit, management does not deduct labor costs because they are considered fixed for the upcoming planning period. However, suppose that overtime can be scheduled in some of the departments. Which departments would you recommend scheduling for overtime? How much would you be willing to pay per hour of overtime in each department? c. Suppose that 10, 6, and 8 hours of overtime may be scheduled in departments A, B, and C, respectively. The cost per hour of overtime is 18 in department A, 22.50 in department B, and 12 in department C. Formulate a linear programming model that can be used to determine the optimal production quantities if overtime is made available. What are the optimal production quantities, and what is the revised total contribution to profit? How much overtime do you recommend using in each department? What is the increase in the total contribution to profit if overtime is used?arrow_forwardBienestar Inc., has the following departmental structure for producing a well-known multivitamin: A consultant designed the following cellular manufacturing structure for the same product: The times above the processes represent the time required to process one unit of product. Required: 1. Calculate the time required to produce a batch of 15 bottles using a batch-processing departmental structure. 2. Calculate the time to process 15 units using cellular manufacturing. 3. How much manufacturing time will the cellular manufacturing structure save for a batch of 15 units?arrow_forwardMott Company recently implemented a JIT manufacturing system. After one year of operation, Heidi Burrows, president of the company, wanted to compare product cost under the JIT system with product cost under the old system. Motts two products are weed eaters and lawn edgers. The unit prime costs under the old system are as follows: Under the old manufacturing system, the company operated three service centers and two production departments. Overhead was applied using departmental overhead rates. The direct overhead costs associated with each department for the year preceding the installation of JIT are as follows: Under the old system, the overhead costs of the service departments were allocated directly to the producing departments and then to the products passing through them. (Both products passed through each producing department.) The overhead rate for the Machining Department was based on machine hours, and the overhead rate for assembly was based on direct labor hours. During the last year of operations for the old system, the Machining Department used 80,000 machine hours, and the Assembly Department used 20,000 direct labor hours. Each weed eater required 1.0 machine hour in Machining and 0.25 direct labor hour in Assembly. Each lawn edger required 2.0 machine hours in Machining and 0.5 hour in Assembly. Bases for allocation of the service costs are as follows: Upon implementing JIT, a manufacturing cell for each product was created to replace the departmental structure. Each cell occupied 40,000 square feet. Maintenance and materials handling were both decentralized to the cell level. Essentially, cell workers were trained to operate the machines in each cell, assemble the components, maintain the machines, and move the partially completed units from one point to the next within the cell. During the first year of the JIT system, the company produced and sold 20,000 weed eaters and 30,000 lawn edgers. This output was identical to that for the last year of operations under the old system. The following costs have been assigned to the manufacturing cells: Required: 1. Compute the unit cost for each product under the old manufacturing system. 2. Compute the unit cost for each product under the JIT system. 3. Which of the unit costs is more accurate? Explain. Include in your explanation a discussion of how the computational approaches differ. 4. Calculate the decrease in overhead costs under JIT, and provide some possible reasons that explain the decrease.arrow_forward
 Cornerstones of Cost Management (Cornerstones Ser...AccountingISBN:9781305970663Author:Don R. Hansen, Maryanne M. MowenPublisher:Cengage Learning
 Managerial AccountingAccountingISBN:9781337912020Author:Carl Warren, Ph.d. Cma William B. TaylerPublisher:South-Western College Pub
 Financial And Managerial AccountingAccountingISBN:9781337902663Author:WARREN, Carl S.Publisher:Cengage Learning,
 Principles of Cost AccountingAccountingISBN:9781305087408Author:Edward J. Vanderbeck, Maria R. MitchellPublisher:Cengage Learning
 Essentials of Business Analytics (MindTap Course ...StatisticsISBN:9781305627734Author:Jeffrey D. Camm, James J. Cochran, Michael J. Fry, Jeffrey W. Ohlmann, David R. AndersonPublisher:Cengage Learning