
Videos
a)
To find the 90% confidence interval for the slope of the regression line.
a)
Answer to Problem 31E
We are 90% confident that the slope of the population of regression line is between 3.29 and 10.01.
Explanation of Solution
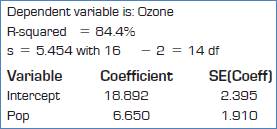
Given:

Formula:
Confidence interval for slope is,
The confidence level = 0.90
So, level of significance =
First need to find critical t value.
tc = 1.761 …Using excel formula, =TINV(0.1,14)
Using formula, 90% confidence interval for the slope of the regression line.
Therefore, we are 90% confident that the slope of the population of regression line is between 3.29 and 10.01.
b)
To find the 90% confidence interval for the mean ozone level.
b)
Answer to Problem 31E
We are 90% confidence that the mean ozone level for cities with 0.6 million people is between 18.47 ppm and 27.29 ppm.
Explanation of Solution
Given:
Formula:
Confidence interval for average of response variable is,
Standard error is,
Therefore, predicted value becomes,
So, standard error is,
The confidence level = 0.90
So, level of significance =
First need to find critical t value.
tc = 1.761 …Using excel formula, =TINV(0.10,14)
Using formula, 90% confidence interval is,
Hence, we are 90% confidence that the mean ozone level for cities with 0.6 million people is between 18.47 ppm and 27.29 ppm.
Chapter 27 Solutions
Stats: Modeling the World Nasta Edition Grades 9-12
Additional Math Textbook Solutions
Statistics for Business and Economics (13th Edition)
Introductory Statistics
Introductory Statistics (2nd Edition)
Elementary Statistics
Elementary Statistics Using Excel (6th Edition)


 MATLAB: An Introduction with ApplicationsStatisticsISBN:9781119256830Author:Amos GilatPublisher:John Wiley & Sons Inc
 Probability and Statistics for Engineering and th...StatisticsISBN:9781305251809Author:Jay L. DevorePublisher:Cengage Learning
 Statistics for The Behavioral Sciences (MindTap C...StatisticsISBN:9781305504912Author:Frederick J Gravetter, Larry B. WallnauPublisher:Cengage Learning
 Elementary Statistics: Picturing the World (7th E...StatisticsISBN:9780134683416Author:Ron Larson, Betsy FarberPublisher:PEARSON
 The Basic Practice of StatisticsStatisticsISBN:9781319042578Author:David S. Moore, William I. Notz, Michael A. FlignerPublisher:W. H. Freeman
 Introduction to the Practice of StatisticsStatisticsISBN:9781319013387Author:David S. Moore, George P. McCabe, Bruce A. CraigPublisher:W. H. Freeman