
Concept explainers
Videos
a)
To make a
a)
Explanation of Solution
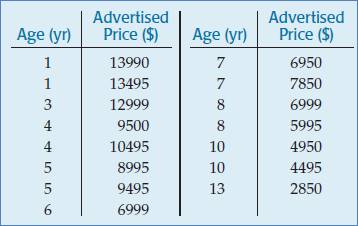
Given:

Following is the scatter plot for given data:

b)
To explain whether the given model is linear.
b)
Answer to Problem 14E
Yes.
Explanation of Solution
Given:


Yes, the given scatter plot shows that pattern is linear. Hence, this data shows the linear model
c)
To find the regression equation.
c)
Answer to Problem 14E
Explanation of Solution
Given:

Using excel,
Therefore, the regression equation is,
d)
To explain condition using residuals.
d)
Explanation of Solution
Given:
Using excel,
The residual plot shows that there is no obvious pattern in the scatter plot and the vertical spread appears to remain constant. Therefore, the conditions for inference appear to be met.
Chapter 27 Solutions
Stats: Modeling the World Nasta Edition Grades 9-12
Additional Math Textbook Solutions
Elementary Statistics Using Excel (6th Edition)
Statistics for Psychology
Introductory Statistics (10th Edition)
An Introduction to Mathematical Statistics and Its Applications (6th Edition)
Introductory Statistics
Intro Stats, Books a la Carte Edition (5th Edition)


 MATLAB: An Introduction with ApplicationsStatisticsISBN:9781119256830Author:Amos GilatPublisher:John Wiley & Sons Inc
 Probability and Statistics for Engineering and th...StatisticsISBN:9781305251809Author:Jay L. DevorePublisher:Cengage Learning
 Statistics for The Behavioral Sciences (MindTap C...StatisticsISBN:9781305504912Author:Frederick J Gravetter, Larry B. WallnauPublisher:Cengage Learning
 Elementary Statistics: Picturing the World (7th E...StatisticsISBN:9780134683416Author:Ron Larson, Betsy FarberPublisher:PEARSON
 The Basic Practice of StatisticsStatisticsISBN:9781319042578Author:David S. Moore, William I. Notz, Michael A. FlignerPublisher:W. H. Freeman
 Introduction to the Practice of StatisticsStatisticsISBN:9781319013387Author:David S. Moore, George P. McCabe, Bruce A. CraigPublisher:W. H. Freeman