
Concept explainers
Videos
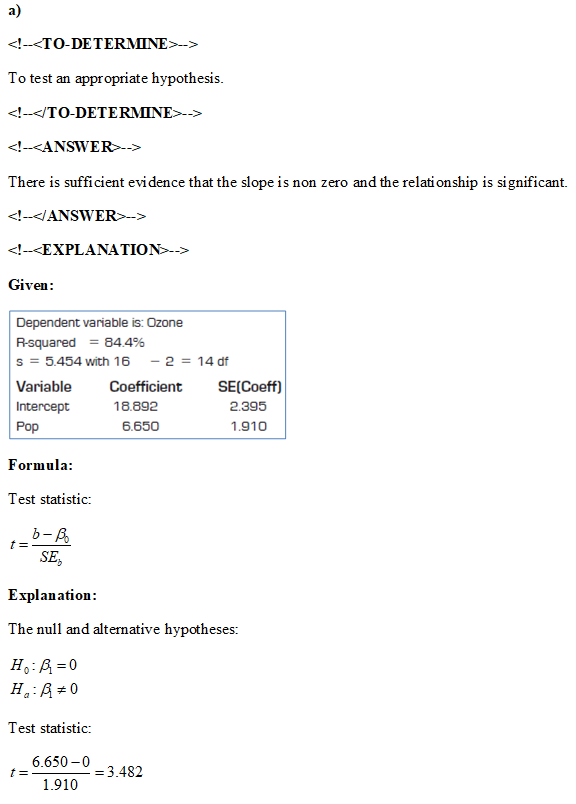
a)
To check the assumptions and conditions for inference.
a)
Explanation of Solution
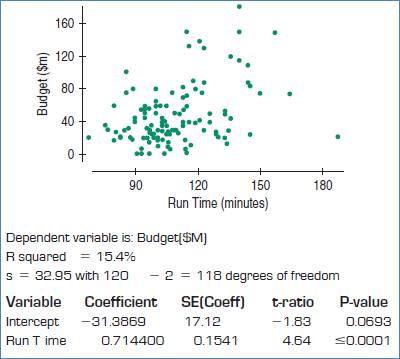
Given:


The conditions are: straight enough, Independence, Randomization, Random residual, Does plot thicken? and Nearly normal condition.
We will check it one by one.
Straight enough condition: Satisfied, because no curvature is present in the
Independence assumption: Satisfied, assuming that the movies are independent.
Randomization condition: Satisfied, assuming that the sample is representative for the population.
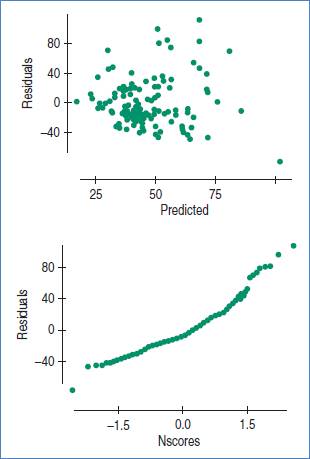
Random residuals condition: Satisfied, because there is no obvious pattern in the residual plot.
Does the plot thicken? condition: Satisfied, because the vertical spread in the residual plot is not increasing or decreasing.
Nearly normal condition: Satisfied, because the normal quantile plot of the residual is roughly linear.
c)
To find the 95% confidence interval for slope.
c)
Answer to Problem 5E
The 95% confidence interval for slope is,
Explanation of Solution
Given:
Formula:
Confidence interval for slope is,
First, need to find critical value
Critical value for df = 118 and confidence level = 0.95 is,
Therefore, the 95% confidence interval for slope is,
Chapter 27 Solutions
Stats: Modeling the World Nasta Edition Grades 9-12
Additional Math Textbook Solutions
Statistics: The Art and Science of Learning from Data (4th Edition)
Statistical Reasoning for Everyday Life (5th Edition)
Elementary Statistics Using Excel (6th Edition)
Essentials of Statistics (6th Edition)


 MATLAB: An Introduction with ApplicationsStatisticsISBN:9781119256830Author:Amos GilatPublisher:John Wiley & Sons Inc
 Probability and Statistics for Engineering and th...StatisticsISBN:9781305251809Author:Jay L. DevorePublisher:Cengage Learning
 Statistics for The Behavioral Sciences (MindTap C...StatisticsISBN:9781305504912Author:Frederick J Gravetter, Larry B. WallnauPublisher:Cengage Learning
 Elementary Statistics: Picturing the World (7th E...StatisticsISBN:9780134683416Author:Ron Larson, Betsy FarberPublisher:PEARSON
 The Basic Practice of StatisticsStatisticsISBN:9781319042578Author:David S. Moore, William I. Notz, Michael A. FlignerPublisher:W. H. Freeman
 Introduction to the Practice of StatisticsStatisticsISBN:9781319013387Author:David S. Moore, George P. McCabe, Bruce A. CraigPublisher:W. H. Freeman