
Concept explainers
Videos
a)
To test an appropriate hypothesis.
a)
Answer to Problem 30E
There is sufficient evidence that the slope is non zero and there is a significant association between sales and profits.
Explanation of Solution
Given:

Formula:
Test statistic:
The null and alternative hypotheses:
Test statistic:
The degrees of freedom = df = 77
Therefore, p-value would be,
P-value = 0 …Using excel formula, =TDIST(12.333,77,2)
Decision: P-value < 0.05, reject H0.
Conclusion: There is sufficient evidence that the slope is non zero and there is a significant association between sales and profits.
b)
To explain whether the company’s sales serve as a useful predictor of its profits.
b)
Answer to Problem 30E
The company’s serve as useful predictor of its profits.
Explanation of Solution
Given:
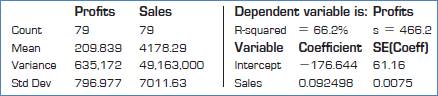
The R-square = 66.2% which is moderately high and standard deviation is 466.2 which is much higher than standard error of coefficient. Therefore, the company’s serve as useful predictor of its profits.
Chapter 27 Solutions
Stats: Modeling the World Nasta Edition Grades 9-12
Additional Math Textbook Solutions
Introductory Statistics (10th Edition)
Statistical Reasoning for Everyday Life (5th Edition)
Elementary Statistics
Elementary Statistics (13th Edition)
Statistics for Business and Economics (13th Edition)


 MATLAB: An Introduction with ApplicationsStatisticsISBN:9781119256830Author:Amos GilatPublisher:John Wiley & Sons Inc
 Probability and Statistics for Engineering and th...StatisticsISBN:9781305251809Author:Jay L. DevorePublisher:Cengage Learning
 Statistics for The Behavioral Sciences (MindTap C...StatisticsISBN:9781305504912Author:Frederick J Gravetter, Larry B. WallnauPublisher:Cengage Learning
 Elementary Statistics: Picturing the World (7th E...StatisticsISBN:9780134683416Author:Ron Larson, Betsy FarberPublisher:PEARSON
 The Basic Practice of StatisticsStatisticsISBN:9781319042578Author:David S. Moore, William I. Notz, Michael A. FlignerPublisher:W. H. Freeman
 Introduction to the Practice of StatisticsStatisticsISBN:9781319013387Author:David S. Moore, George P. McCabe, Bruce A. CraigPublisher:W. H. Freeman