
Concept explainers
Videos
a)
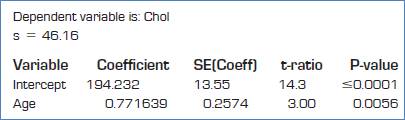
To explain s = 46.16.
a)
Explanation of Solution
Given:

s = 46.16 is the standard deviation of the residuals.
This means that the actual values vary on average by 46.16 about the predicted values.
b)
To find the value of standard error.
b)
Answer to Problem 10E
Explanation of Solution
Given:

The value of standard error of the slope of the regression line is,
c)
To explain the meaning of standard error.
c)
Explanation of Solution
Given:
The value of standard error of the slope of the regression line is,
Therefore, the slope of the regression line of different samples is expected to vary on average by 0.2574 per year.
Chapter 27 Solutions
Stats: Modeling the World Nasta Edition Grades 9-12
Additional Math Textbook Solutions
Introductory Statistics
Statistics: The Art and Science of Learning from Data (4th Edition)
STATS:DATA+MODELS-W/DVD
Essentials of Statistics (6th Edition)
Statistical Reasoning for Everyday Life (5th Edition)
Basic Business Statistics, Student Value Edition (13th Edition)


 MATLAB: An Introduction with ApplicationsStatisticsISBN:9781119256830Author:Amos GilatPublisher:John Wiley & Sons Inc
 Probability and Statistics for Engineering and th...StatisticsISBN:9781305251809Author:Jay L. DevorePublisher:Cengage Learning
 Statistics for The Behavioral Sciences (MindTap C...StatisticsISBN:9781305504912Author:Frederick J Gravetter, Larry B. WallnauPublisher:Cengage Learning
 Elementary Statistics: Picturing the World (7th E...StatisticsISBN:9780134683416Author:Ron Larson, Betsy FarberPublisher:PEARSON
 The Basic Practice of StatisticsStatisticsISBN:9781319042578Author:David S. Moore, William I. Notz, Michael A. FlignerPublisher:W. H. Freeman
 Introduction to the Practice of StatisticsStatisticsISBN:9781319013387Author:David S. Moore, George P. McCabe, Bruce A. CraigPublisher:W. H. Freeman