
Concept explainers
Videos
a)
To test an appropriate hypothesis.
a)
Answer to Problem 29E
There is sufficient evidence that the slope is non zero and the relationship is significant.
Explanation of Solution
Given:

Formula:
Test statistic:
The null and alternative hypotheses:
Test statistic:
The degrees of freedom = df = 14
Therefore, p-value would be,
P-value = 0.0037 …Using excel formula, =TDIST(3.482,14,2)
Decision: P-value < 0.05, reject H0.
Conclusion: There is sufficient evidence that the slope is non zero and the relationship is significant.
b)
To explain whether the population of a city is a useful predictor of ozone level.
b)
Answer to Problem 29E
The population of city is useful predictor.
Explanation of Solution
Given:
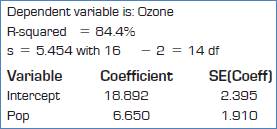
The R-square = 84.4% which is high. Therefore, the population of city is useful predictor.
Chapter 27 Solutions
Stats: Modeling the World Nasta Edition Grades 9-12
Additional Math Textbook Solutions
Essentials of Statistics, Books a la Carte Edition (5th Edition)
Statistics for Psychology
Introductory Statistics (10th Edition)
Elementary Statistics: Picturing the World (7th Edition)
Elementary Statistics: Picturing the World (6th Edition)
Introductory Statistics (2nd Edition)


 MATLAB: An Introduction with ApplicationsStatisticsISBN:9781119256830Author:Amos GilatPublisher:John Wiley & Sons Inc
 Probability and Statistics for Engineering and th...StatisticsISBN:9781305251809Author:Jay L. DevorePublisher:Cengage Learning
 Statistics for The Behavioral Sciences (MindTap C...StatisticsISBN:9781305504912Author:Frederick J Gravetter, Larry B. WallnauPublisher:Cengage Learning
 Elementary Statistics: Picturing the World (7th E...StatisticsISBN:9780134683416Author:Ron Larson, Betsy FarberPublisher:PEARSON
 The Basic Practice of StatisticsStatisticsISBN:9781319042578Author:David S. Moore, William I. Notz, Michael A. FlignerPublisher:W. H. Freeman
 Introduction to the Practice of StatisticsStatisticsISBN:9781319013387Author:David S. Moore, George P. McCabe, Bruce A. CraigPublisher:W. H. Freeman