
Concept explainers
Videos
Research into cigarette-smoking habits, smoking prevention, and cessation programs necessitates accurate measurement of smoking behavior. However, decreasing social acceptability of smoking appears to cause significant underreporting. Chemical markers for cigarette use can provide objective indicators of smoking behavior. One widely used noninvasive marker is the level of saliva thiocyanate (SCN). In a Minneapolis school district, 1332 students in eighth grade (ages 12–14) participated in a study [12] whereby they
- (1) Viewed a film illustrating how recent cigarette use could be readily detected from small samples of saliva
- (2) Provided a personal sample of SCN
- (3) Provided a self-report of the number of cigarettes smoked per week
The results are given in Table 3.10.
TABLE 3.10 Relationship between SCN levels and self-reported cigarettes smoked per week
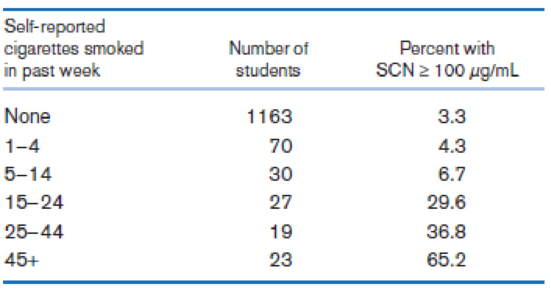
Source: Based on the American Journal of Public Health, 71(12), 1320, 1981.
Suppose the self-reports are completely accurate and are representative of the number of eighth-grade students who smoke in the general community. We are considering using an SCN level ≥ 100 μg/mL as a test criterion for identifying cigarette smokers. Regard a student as positive if he or she smokes one or more cigarettes per week.
What is the sensitivity of the test for light-smoking students (students who smoke ≤ 14 cigarettes per week)?
Want to see the full answer?
Check out a sample textbook solution
Chapter 3 Solutions
Fundamentals of Biostatistics


- A low-level CDC bureaucrat wants to please his boss by gathering evidence thatthe current government-mandated shutdown of society is not causing people’s mentalhealth to deteriorate, so that it can safely be continued for several years if anyexpert says it’s necessary.He polls a random sample of 1600 citizens, gathering data on such items asincome loss, weight gain, access to toilet paper, hours spent binge-watchingNetflix, and number of injuries caused by household fights, and compiles all thisinto a scientifically-weighted “misery index”.The mean misery index from the sample is 99.2; it seems reasonable to use apopulation standard deviation σ = 19.1.a) Does this information provide significant evidence (at the 5% level) that thenationwide mean misery index is less than 100? Set up appropriate null andalternative hypotheses, calculate the appropriate test statistic, find the P-value,and state your conclusion. (10)b) A CDC press release publishing the results of this study claims that…arrow_forwardA low-level CDC bureaucrat wants to please his boss by gathering evidence thatthe current government-mandated shutdown of society is not causing people’s mentalhealth to deteriorate, so that it can safely be continued for several years if anyexpert says it’s necessary.He polls a random sample of 1600 citizens, gathering data on such items asincome loss, weight gain, access to toilet paper, hours spent binge-watchingNetflix, and number of injuries caused by household fights, and compiles all thisinto a scientifically-weighted “misery index”.The mean misery index from the sample is 99.2; it seems reasonable to use apopulation standard deviation σ = 19.1.a) Does this information provide significant evidence (at the 5% level) that thenationwide mean misery index is less than 100? Set up appropriate null andalternative hypotheses, calculate the appropriate test statistic, find the P-value,and state your conclusion. b) A CDC press release publishing the results of this study claims that…arrow_forwardIs the crime rate in New York different from the crime rate in New Jersey? Independent random samples from region A (cities in New York) and region B (cities in New Jersey) gave the following information about violent crime rate (number of violent crimes per 100,000 population). (Reference: U.S. Department of Justice, Federal Bureau of Investigation.) Region A 467 454 409 607 562 503 602 516 610 590 453 Region B 406 569 517 408 532 465 501 457 443 617 613 524 Use a 10% level of significance to test the claim that there is no difference in the crime rate distributions of the two states. (a) What is the level of significance? (b) Compute the sample test statistic. (Use 2 decimal places.) (c) Find the P-value of the sample test statistic. (Use 4 decimal places.)arrow_forward
- In its January 25, 2012, issue, the Journal of the American Medical Association reported on the effects of overconsumption of low, normal, and high protein diets on weight gain, energy expenditure, and body composition. Researchers conducted a single blind, randomized controlled trial of 25 U.S. adults. The subjects were healthy, weight-stable, male and female volunteers, aged 18 to 35 years. All subjects consumed a weight-stabilizing diet for 13 to 25 days. Afterwards, the researchers randomly assigned participants to diets containing various percentages of energy from protein: 5% (low protein), 15% (normal protein), or 25% (high protein). The subjects were not aware of the specific protein level diet to which they were assigned. On these diets the researchers overfed the participants during the last 8 weeks of their 10 to 12 week stay in the inpatient metabolic unit. The goal was to investigate the effect of overconsumption of protein on weight gain, energy expenditure, and body…arrow_forwardHospital re-admissions for patients with congestive heart failure (CHF) are relatively common and costly occurrences within the U.S. health infrastructure, including the Veterans Affairs (VA) healthcare system. Little is known about CHF re-admissions among rural veteran patients, including the effects of socio-demographics and follow-up outpatient visits on these re-admissions. Purpose: To examine socio-demographics of U.S. veterans with CHF who had 30 day potentially preventable re-admissions and compare the effect of 30 days VA post-discharge service use on these re-admissions for rural- and urban-dwelling veterans. (muus, Knedson, Klug, Gokun, Sarrazin, & Kaboli, 2010). 30 Day Re-admission Location of Residence Yes No Urban 17,872 3,792 Rural 9,428 1,906 When comparing the rates of re-admission for urban versus rural veterans, the authors obtained a p-value of 0.921 from a chi-square test of independence. What does this…arrow_forwardHospital re-admissions for patients with congestive heart failure (CHF) are relatively common and costly occurrences within the U.S. health infrastructure, including the Veterans Affairs (VA) healthcare system. Little is known about CHF re-admissions among rural veteran patients, including the effects of socio-demographics and follow-up outpatient visits on these re-admissions. Purpose: To examine socio-demographics of U.S. veterans with CHF who had 30 day potentially preventable re-admissions and compare the effect of 30 days VA post-discharge service use on these re-admissions for rural- and urban-dwelling veterans. (muus, Knedson, Klug, Gokun, Sarrazin, & Kaboli, 2010). 30 Day Re-admission Location of Residence Yes No Urban 17,872 3,792 Rural 9,428 1,906 The authors want to investigate re-admission rates for two-cohorts (urban and rural residence). Based on the information in the preceding table, create a table that provides…arrow_forward
- A cross-sectional study is conducted to investigate cardiovascular disease (CVD) risk factors among a sample of patients seeking medical care at one of three local hospitals. A total of 500500 patients are enrolled. Based on the following data, we would like to determine if there is a significant association between the family history of CVD and the enrollment site. Enrollment Site Family History of CVD Hospital 1 Hospital 2 Hospital 3 Total Yes 34 8 58 100 No 104 72 224 400 Total 138 80 282 500 Given: The value of the test statistic is χ2= 6.912 Use α=0.1 as the level of significance. The superintendent of Hospital 2 performed the Goodness of Fit Test to test whether 25% of the patients go to Hospital 1, 15% of the patients go to Hospital 2 and 60% of the patients go to Hospital 3. Given: The superintendent found that the pp-value for the test is 0.25091 Let: p1=p1= be the proportion of patients at Hospital 1 p2=p2= be the proportion of patients at…arrow_forwardCaroll, Gail, and Lubin (1993) describe a case–control study in which 39 women with cervical cancer and 76 women without cervical cancer were screened for exposure to Herpes simplex virus. Investigators expect that roughly 30% of the controls will have Herpes simplex virus exposure, and expect under their alternative hypothesis to see an elevated proportion of the cases to have Herpes simplex virus exposure, with an odds ratio of 1.4. a. Calculate the power for detecting an effect this large for a one-sided test of size .025. b. Suppose that the investigators wanted 80% power under the above alternative, and planned to use the same number of cases and controls. How many women would be necessary in each group? c. Suppose that the investigators wanted 80% power under the above alternative, and planned to use ten times as many controls as cases. How many women would be necessary in each group? Compare your answer to part (b).arrow_forwardTo combat antibiatic resistance, the Quality Consortium recommends a throat swab to confirm strep throat before a physician prescribes antibiotics to children under age 5. Nationally, 40 percent of children under 5 who received antibiotics did not have a throat swab. The Colorado Department of health took a random sample of 88children under the age of 5who received antibiotics for throat infections and found that 30 did not have a throat swab. At a=.05, is this a statistically significant reduction over last years national rate of 40 percent?arrow_forward
- To combat antibiatic resistance, the Quality Consortium recommends a throat swab to confirm strep throat before a physician prescribes antibiotics to children under age 5. Nationally, 40 percent of children under 5 who received antibiotics did not have a throat swab. The Colorado Department of health took a random sample of 88children under the age of 5who received antibiotics for throat infections and found that 30 did not have a throat swab. At a=.05, is this a statistically significant reduction over last years national rate of 40 percent?What is the test statistic?arrow_forwardIdentify the independent/predictor and dependent/outcome variable in the following research question: Does implementing trauma-informed education in elementary schools affect the rate of student behavior referrals?arrow_forwardIn a research to study the gender differences in receiving Lidocaine therapy in Acure Myocardial infarction (AMI) patients older than 75 years who have a history of hypertension and strokes, there were 81 patients in total (30 males and 51 females). The following table provides the outcomes. Therapy Gender Receive Not receive Total Male 8 22 30 Female 16 35 51 Total 24 57 81 According to the hypothesis that there is no association between receive Lidocaine therapy and gender, what does the minimum expected cell count in this table? Based on the answer to part a, which test should you use to test the hypothesis of no association between receive Lidocaine therapy and gender? Test the hypothesis whether the receiving Lidocaine therapy is independent of their gender at .05 significance level. Find the critical value and p-value, respectively. Therapy Gender Receive Not receive Total Male 2 28 30…arrow_forward
 Glencoe Algebra 1, Student Edition, 9780079039897...AlgebraISBN:9780079039897Author:CarterPublisher:McGraw Hill