
Concept explainers
Videos
Pulmonary Disease
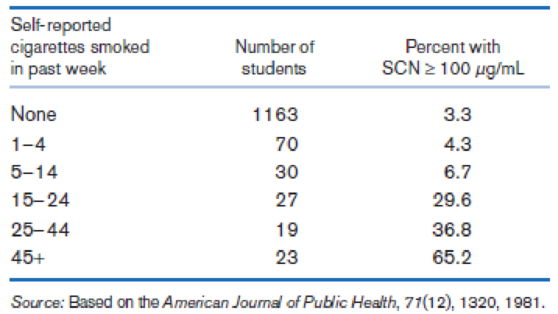
Research into cigarette-smoking habits, smoking prevention, and cessation programs necessitates accurate measurement of smoking behavior. However, decreasing social acceptability of smoking appears to cause significant underreporting. Chemical markers for cigarette use can provide objective indicators of smoking behavior. One widely used noninvasive marker is the level of saliva thiocyanate (SCN). In a Minneapolis school district, 1332 students in eighth grade (ages 12–14) participated in a study [12] whereby they
- (1) Viewed a film illustrating how recent cigarette use could be readily detected from small samples of saliva
- (2) Provided a personal sample of SCN
- (3) Provided a self-report of the number of cigarettes smoked per week
The results are given in Table 3.10.
Table 3.10 Relationship between SCN levels and self-reported cigarettes smoked per week
Suppose the self-reports are completely accurate and are representative of the number of eighth-grade students who smoke in the general community. We are considering using an SCN level ≥ 100 μg/mL as a test criterion for identifying cigarette smokers. Regard a student as positive if he or she smokes one or more cigarettes per week.
Suppose we regard the self-reports of all students who report some cigarette consumption as valid but estimate that 20% of students who report no cigarette consumption actually smoke 1–4 cigarettes per week and an additional 10% smoke 5–14 cigarettes per week.
Compute the PV− under these altered assumptions. How does the true PV− using a screening criterion of SCN ≥ 100 μg/mL for identifying smokers compare with the PV− based on self-reports obtained in Problem 3.73?
3.73 What is the PV− of the test?

Trending nowThis is a popular solution!

Chapter 3 Solutions
Fundamentals of Biostatistics


- The Behavioral Risk Factor Surveillance System (BRFSS) is an annual telephone survey designed to identify risk factors in the adult population and report emerging health trends. The following table displays the distribution of health status of respondents to this survey (excellent, very good, good, fair, poor) and whether or not they have health insurance. Excellent Very good Good Fair Poor Total No health coverage 459 727 854 385 99 2524 Health coverage 4198 6245 4821 1634 578 17476 Total 4657 6972 5675 2019 667 20000 (a) Why is being in excellent health and having health coverage not mutally exclusive? Please leave a detailed answer and how you found out. (b) If we draw one individual at random, what is the probability that the respondent has excellent health or doesn't have health coverage? Please leave a detailed answer on how you found that answer. (c) What is the probability that a randomly chosen individual has excellent health given that he has health…arrow_forwardIs the crime rate in New York different from the crime rate in New Jersey? Independent random samples from region A (cities in New York) and region B (cities in New Jersey) gave the following information about violent crime rate (number of violent crimes per 100,000 population). (Reference: U.S. Department of Justice, Federal Bureau of Investigation.) Region A 408 457 423 557 409 579 483 417 425 421 606 Region B 391 465 389 479 390 482 434 620 400 442 433 405 Use a 5% level of significance to test the claim that there is no difference in the crime rate distributions of the two states. (a) What is the level of significance? (b) Compute the sample test statistic. (Use 2 decimal places.) (c) Find the P-value of the sample test statistic. (Use 4 decimal places.)arrow_forwardA cross-sectional study is conducted to investigate cardiovascular disease (CVD) risk factors among a sample of patients seeking medical care at one of three local hospitals. A total of 500500 patients are enrolled. Based on the following data, we would like to determine if there is a significant association between the family history of CVD and the enrollment site. Enrollment Site Family History of CVD Hospital 1 Hospital 2 Hospital 3 Total Yes 34 8 58 100 No 104 72 224 400 Total 138 80 282 500 Given: The value of the test statistic is χ2= 6.912 Use α=0.1 as the level of significance. The superintendent of Hospital 2 performed the Goodness of Fit Test to test whether 25% of the patients go to Hospital 1, 15% of the patients go to Hospital 2 and 60% of the patients go to Hospital 3. Given: The superintendent found that the pp-value for the test is 0.25091 Let: p1=p1= be the proportion of patients at Hospital 1 p2=p2= be the proportion of patients at…arrow_forward
- Caroll, Gail, and Lubin (1993) describe a case–control study in which 39 women with cervical cancer and 76 women without cervical cancer were screened for exposure to Herpes simplex virus. Investigators expect that roughly 30% of the controls will have Herpes simplex virus exposure, and expect under their alternative hypothesis to see an elevated proportion of the cases to have Herpes simplex virus exposure, with an odds ratio of 1.4. a. Calculate the power for detecting an effect this large for a one-sided test of size .025. b. Suppose that the investigators wanted 80% power under the above alternative, and planned to use the same number of cases and controls. How many women would be necessary in each group? c. Suppose that the investigators wanted 80% power under the above alternative, and planned to use ten times as many controls as cases. How many women would be necessary in each group? Compare your answer to part (b).arrow_forwardIs the crime rate in New York different from the crime rate in New Jersey? Independent random samples from region A (cities in New York) and region B (cities in New Jersey) gave the following information about violent crime rate (number of violent crimes per 100,000 population). (Reference: U.S. Department of Justice, Federal Bureau of Investigation.) Region A 436 408 539 489 439 600 402 595 422 434 486 Region B 438 435 428 556 534 470 616 401 478 430 379 415 Use a 10% level of significance to test the claim that there is no difference in the crime rate distributions of the two states. (a) What is the level of significance?State the null and alternate hypotheses. Ho: Distributions are different. H1: Distributions are the same.Ho: Distributions are the same. H1: Distributions are different. Ho: Distributions are the same. H1: Distributions are the same.Ho: Distributions are different. H1: Distributions are different. (b) Compute the sample test statistic. (Use 2 decimal…arrow_forwardAs health-care costs continue to increase, the number of employers who offer their employees telehealth options is growing. In 2021, net cost savings is estimated to be $19–$121 per telemedicine visit, depending on where the employee would have otherwise sought care (First Stop Health). The data shown below ($), for a random sample of 20 online doctor visits, are consistent with the savings per visit reported by First Stop Health. 93 106 55 77 94 77 52 33 84 48 49 73 92 83 41 56 41 97 74 101 Assuming the population is roughly symmetric, construct a 95% confidence interval for the mean savings (in dollars) for a televisit to the doctor as opposed to an office visit. (Round your answers to the nearest cent.)arrow_forward
- Prenatal vitamins and Autism. Researchers studying the link between prenatal vitamin use and autism surveyed the mothers of a random sample of children aged 24 - 60 months with autism and conducted another separate random sample for children with typical development. The table below shows the number of mothers in each group who did and did not use prenatal vitamins during the three months before pregnancy.arrow_forwardIn a research to study the gender differences in receiving Lidocaine therapy in Acure Myocardial infarction (AMI) patients older than 75 years who have a history of hypertension and strokes, there were 81 patients in total (30 males and 51 females). The following table provides the outcomes. Therapy Gender Receive Not receive Total Male 8 22 30 Female 16 35 51 Total 24 57 81 According to the hypothesis that there is no association between receive Lidocaine therapy and gender, what does the minimum expected cell count in this table? Based on the answer to part a, which test should you use to test the hypothesis of no association between receive Lidocaine therapy and gender? Test the hypothesis whether the receiving Lidocaine therapy is independent of their gender at .05 significance level. Find the critical value and p-value, respectively. Therapy Gender Receive Not receive Total Male 2 28 30…arrow_forwardA study is performed to assess the prevalence of use of anti-hypertensive medication (MEDS) in the non-institutionalized U.S. population. The following data are reported for MEDS status of the U.S. population by age-sex group: Table 1 Estimated MEDS Status of the U.S. Population by age and sex group, NHANES study 1999-2018 Males Females Age Group MEDS = yes Na Age Group MEDS = yes Na 18-29 160,617 23,069,867 18-29 168,940 22,132,949 30-39 899,152 18,690,754 30-39 759,532 18,937,878 40-49 2,264,304 18,316,125 40-49 2,257,203 18,816,304 50-59 3,215,688 15,022,905 50-59 4,059,363 15,997,653 60-69 2,936,183 8,400,156 60-69 4,260,975 10,993,805 70-79 1,677,664 4,012,930 70-79 2,953,646 6,012,728 aN = total sample size in specific age-sex groups. a. What is the prevalence of use of MEDS in 40-49 year-old females? b. Suppose a married couple consists…arrow_forward
- A low-level CDC bureaucrat wants to please his boss by gathering evidence thatthe current government-mandated shutdown of society is not causing people’s mentalhealth to deteriorate, so that it can safely be continued for several years if anyexpert says it’s necessary.He polls a random sample of 1600 citizens, gathering data on such items asincome loss, weight gain, access to toilet paper, hours spent binge-watchingNetflix, and number of injuries caused by household fights, and compiles all thisinto a scientifically-weighted “misery index”.The mean misery index from the sample is 99.2; it seems reasonable to use apopulation standard deviation σ = 19.1.a) Does this information provide significant evidence (at the 5% level) that thenationwide mean misery index is less than 100? Set up appropriate null andalternative hypotheses, calculate the appropriate test statistic, find the P-value,and state your conclusion. (10)b) A CDC press release publishing the results of this study claims that…arrow_forwardA low-level CDC bureaucrat wants to please his boss by gathering evidence thatthe current government-mandated shutdown of society is not causing people’s mentalhealth to deteriorate, so that it can safely be continued for several years if anyexpert says it’s necessary.He polls a random sample of 1600 citizens, gathering data on such items asincome loss, weight gain, access to toilet paper, hours spent binge-watchingNetflix, and number of injuries caused by household fights, and compiles all thisinto a scientifically-weighted “misery index”.The mean misery index from the sample is 99.2; it seems reasonable to use apopulation standard deviation σ = 19.1.a) Does this information provide significant evidence (at the 5% level) that thenationwide mean misery index is less than 100? Set up appropriate null andalternative hypotheses, calculate the appropriate test statistic, find the P-value,and state your conclusion. b) A CDC press release publishing the results of this study claims that…arrow_forwardTo combat antibiatic resistance, the Quality Consortium recommends a throat swab to confirm strep throat before a physician prescribes antibiotics to children under age 5. Nationally, 40 percent of children under 5 who received antibiotics did not have a throat swab. The Colorado Department of health took a random sample of 88children under the age of 5who received antibiotics for throat infections and found that 30 did not have a throat swab. At a=.05, is this a statistically significant reduction over last years national rate of 40 percent?arrow_forward
 Glencoe Algebra 1, Student Edition, 9780079039897...AlgebraISBN:9780079039897Author:CarterPublisher:McGraw Hill