Construct an ROC curve based on the table constructed in Problem 3.89. Mental Health The Chinese Mini-Mental Status Test (CMMS) consists of 114 items intended to identify people with Alzheimer’s disease and senile dementia among people in China [14]. An extensive clinical evaluation of this instrument was performed, whereby participants were interviewed by psychiatrists and nurses and a definitive diagnosis of dementia was made. Table 3.13 shows the results obtained for the subgroup of people with at least some formal education. TABLE 3.13 Relationship of clinical dementia to outcome on the Chinese Mini-Mental Status Test The cutoff value of 20 on the CMMS used to identify people with dementia is arbitrary. Suppose we consider changing the cutoff. What are the sensitivity and specificity if cutoffs of 5, 10, 15, 20, 25, or 30 are used? Make a table of your results.
Construct an ROC curve based on the table constructed in Problem 3.89. Mental Health The Chinese Mini-Mental Status Test (CMMS) consists of 114 items intended to identify people with Alzheimer’s disease and senile dementia among people in China [14]. An extensive clinical evaluation of this instrument was performed, whereby participants were interviewed by psychiatrists and nurses and a definitive diagnosis of dementia was made. Table 3.13 shows the results obtained for the subgroup of people with at least some formal education. TABLE 3.13 Relationship of clinical dementia to outcome on the Chinese Mini-Mental Status Test The cutoff value of 20 on the CMMS used to identify people with dementia is arbitrary. Suppose we consider changing the cutoff. What are the sensitivity and specificity if cutoffs of 5, 10, 15, 20, 25, or 30 are used? Make a table of your results.
Construct an ROC curve based on the table constructed in Problem 3.89.
Mental Health
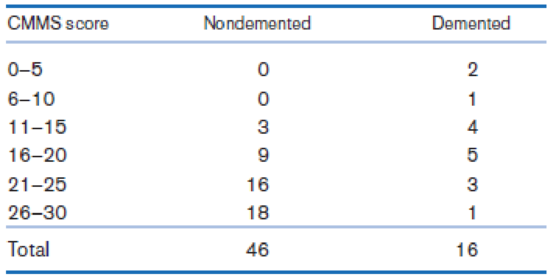
The Chinese Mini-Mental Status Test (CMMS) consists of 114 items intended to identify people with Alzheimer’s disease and senile dementia among people in China [14]. An extensive clinical evaluation of this instrument was performed, whereby participants were interviewed by psychiatrists and nurses and a definitive diagnosis of dementia was made. Table 3.13 shows the results obtained for the subgroup of people with at least some formal education.
TABLE 3.13 Relationship of clinical dementia to outcome on the Chinese Mini-Mental Status Test
The cutoff value of 20 on the CMMS used to identify people with dementia is arbitrary. Suppose we consider changing the cutoff. What are the sensitivity and specificity if cutoffs of 5, 10, 15, 20, 25, or 30 are used? Make a table of your results.
Drop-off points (points de collecte in French), where residents can dispose of their organic waste for composting, were established in each of the five targeted neighborhoods of PROBLEM 1. Camille wants to see whether or not there exists a relationship between the average weekly amount of non-disposed food waste per household and the availability of drop-off points in the neighborhood, expressed as the number of households per drop-off point (considered fixed). Her data and some of her preliminary calculations are presented below:
Camille also calculated the slope of the fitted regression line: estimated slope = 0.008. Test whether or not the availability of drop-off points in the neighborhood has a linear effect on the amount of non-disposed food waste per household. Use α = 0.10.
Question 5: A college is interested in if the year of receiving high-level education (college and above) influences students’ salaries when they join the working field. The college randomly selected 4 students who recently received a full- time work offer and collected their year of receiving high-level education and salary per week. The raw data is:
Participant
Year of high-level education
Salary per week
Participant 1
4
1150
Participant 2
5
1300
Participant 3
7
1600
Participant 4
2
750
Plot the scatterplot and label the participants.
Calculate the correlation coefficient between the year of high-level education and salary per week.
Calculate the regression equation using the year of receiving high-level education to predict the salary per week.
If a student graduate from college and graduate school in a total of 6 years, what is this student’s predicted salary per week?
The following data were collected in the study described in Problem 1 relating hypertensive status measured at baseline to incident stroke over 5 years.
Free of Stroke at 5 Years
Stroke
Baseline: Not Hypertensive
932
58
Baseline: Hypertensive
254
106
Compute the incidence of stroke in this study, overall.
0.294
0.121
0.059
0.879
Need a deep-dive on the concept behind this application? Look no further. Learn more about this topic, statistics and related others by exploring similar questions and additional content below.
Correlation Vs Regression: Difference Between them with definition & Comparison Chart; Author: Key Differences;https://www.youtube.com/watch?v=Ou2QGSJVd0U;License: Standard YouTube License, CC-BY
Correlation and Regression: Concepts with Illustrative examples; Author: LEARN & APPLY : Lean and Six Sigma;https://www.youtube.com/watch?v=xTpHD5WLuoA;License: Standard YouTube License, CC-BY


 College AlgebraAlgebraISBN:9781305115545Author:James Stewart, Lothar Redlin, Saleem WatsonPublisher:Cengage Learning