
Concept explainers
Videos
Laboratory measures of cardiovascular reactivity are receiving increasing attention. Much of the expanded interest is based on the belief that these measures, obtained under challenge from physical and psychological stressors, may yield a more biologically meaningful index of cardiovascular
TABLE 3.11 Classification of cardiovascular reactivity using an automated and a manual sphygmomanometer
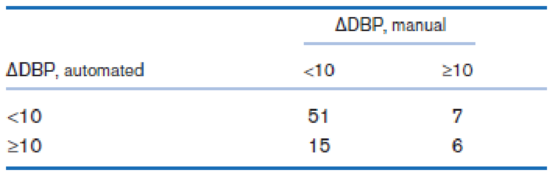
If the population tested is representative of the general population, then what are the PV+ and PV− using this test?

Trending nowThis is a popular solution!

Chapter 3 Solutions
Fundamentals of Biostatistics


- Urban Travel Times Population of cities and driving times are related, as shown in the accompanying table, which shows the 1960 population N, in thousands, for several cities, together with the average time T, in minutes, sent by residents driving to work. City Population N Driving time T Los Angeles 6489 16.8 Pittsburgh 1804 12.6 Washington 1808 14.3 Hutchinson 38 6.1 Nashville 347 10.8 Tallahassee 48 7.3 An analysis of these data, along with data from 17 other cities in the United States and Canada, led to a power model of average driving time as a function of population. a Construct a power model of driving time in minutes as a function of population measured in thousands b Is average driving time in Pittsburgh more or less than would be expected from its population? c If you wish to move to a smaller city to reduce your average driving time to work by 25, how much smaller should the city be?arrow_forwardWhat does the y -intercept on the graph of a logistic equation correspond to for a population modeled by that equation?arrow_forwardCompare the two separate scatterplots. In particular, how do the associtation compare between women with pets vs. women without pets? Does one group have more variation in systolic blood pressure than the other? If so, for which group? Does systolic blood pressure seem higher for common ages between the two groups? If so, for which group?arrow_forward
- The study “Evaluation of Prescribed Burning in Relation to Available Deer Browse” was undertaken at the Virginia Polytechnic Institute and State University in 1964 to determine if fire can be used as a viable management tool to increase the amount of forage available to deer during the crucial months in late winter and spring. Calcium is a required element for plants and animals. The amount taken up and stored in the plant is closely correlated to the amount present in the soil. It was hypothesized that fire may change the calcium levels present in the soil and thus affect the amount available to the deer. A large tract of land in the Fishburn Forest was selected for a prescribed burn. Soil samples were taken from 12 plots of equal area just prior to the burn on May 20, 1964, and analyzed for calcium. On July 16, 1964, postburn calcium levels were analyzed from the same plots. These values, in kilograms per plot, are presented in the following table. Do these data support the…arrow_forwardWe are testing whether a particular program of low impact exercise can improve the cholesterol level of stroke patients. We enroll a group of stroke patients in our study, and after six weeks we measure their serum cholesterol level in mmol/L, resulting in the following data: 6.1 9.3 6.3 4 9 5.5 6.3 4.2 4.7 7.8 4.3 7.5 9.1 4.2 6.9 8.1 5.6 9.4 8.3 8.8 7.2 5.7 6.5 3.8 3.8 9 9.4 4.5 8 7 4.5 9.4 6.6 4.1 6.6 9.1 3.9 5.3 (a) Construct a 95% confidence interval. _______< u < ______ From an existing study, we know that the average cholesterol level of all stroke patients is 7 mmol/L. We want to know if the level in our patients is significantly different from this. (b) What is our Test statistic? ______ (c) What is the two-tailed p-value of this result? ______arrow_forwardOn occasion, medical studies need to model the proportion of the population that has a disease and compare that to observed frequencies of the disease actually occurring. Suppose the end-stage renal failure in south-west Wales was collected for different age groups. Do the data in the table show that the observed frequencies are in agreement with proportion of people in each age group? Test at the 1% level. Renal Failure Frequencies Age group 16-29 30-44 45-59 60-74 75+ Total Observed Frequencies 125 152 134 124 48 583 Expected Proportion 0.23 0.25 0.22 0.21 0.09 State the hypotheses.H0: The observed frequencies in agreement with proportion of people in each age group.Ha: The observed frequencies in agreement with proportion of people in each age group. Calculate the χ2 test statistic. Round expected values to two decimal places. Round χ2 to 3 decimal places.χ2 = Calculate the p-value. Round to 3 decimal places.p-value = State your decision.Since p-value α,…arrow_forward
- A deficiency of the trace element selenium in the diet can negatively impact growth, immunity, muscle and neuromuscular function, and fertility. The introduction of selenium supplements to dairy cows is justified when pastures have low selenium levels. Authors of a research paper supplied the following data on milk selenium concentration (mg/L) for a sample of cows given a selenium supplement (the treatment group) and a control sample given no supplement, both initially and after a 9-day period. Initial Measurement Treatment Control 11.2 9.1 9.6 8.7 10.1 9.7 8.5 10.8 10.3 10.9 10.6 10.6 11.7 10.1 9.7 12.3 10.8 8.8 10.3 10.4 10.4 10.9 11.2 10.4 9.4 11.6 10.6 10.9 10.7 8.4 After 9 Days Treatment Control 138.3 9.3 104 8.7 96.4 8.7 89 10.1 88 9.6 103.8 8.6 147.3 10.2 97.1 12.2 172.6 9.3 146.3 9.5 99 8.2 122.3 8.9 103 12.5 117.8 9.1 121.5 93 (a) Use the given data for the treatment group to determine if there…arrow_forwardA deficiency of the trace element selenium in the diet can negatively impact growth, immunity, muscle and neuromuscular function, and fertility. The introduction of selenium supplements to dairy cows is justified when pastures have low selenium levels. Authors of a research paper supplied the following data on milk selenium concentration (mg/L) for a sample of cows given a selenium supplement (the treatment group) and a control sample given no supplement, both initially and after a 9-day period. Initial Measurement Treatment Control 11.3 9.1 9.7 8.7 10.1 9.7 8.5 10.8 10.4 10.9 10.7 10.6 11.8 10.1 9.8 12.3 10.6 8.8 10.4 10.4 10.2 10.9 11.3 10.4 9.2 11.6 10.7 10.9 10.8 8.2 After 9 Days Treatment Control 138.3 9.4 104 8.8 96.4 8.8 89 10.1 88 9.7 103.8 8.7 147.3 10.3 97.1 12.3 172.6 9.4 146.3 9.5 99 8.3 122.3 8.9 103 12.5 117.8 9.1 121.5 93 (a) Use the given data for the treatment group to determine if…arrow_forwardA deficiency of the trace element selenium in the diet can negatively impact growth, immunity, muscle and neuromuscular function, and fertility. The introduction of selenium supplements to dairy cows is justified when pastures have low selenium levels. Authors of a research paper supplied the following data on milk selenium concentration (mg/L) for a sample of cows given a selenium supplement (the treatment group) and a control sample given no supplement, both initially and after a 9-day period. Initial Measurement Treatment Control 11.4 9.1 9.6 8.7 10.1 9.7 8.5 10.8 10.2 10.9 10.6 10.6 11.9 10.1 9.9 12.3 10.7 8.8 10.2 10.4 10.3 10.9 11.4 10.4 9.3 11.6 10.6 10.9 10.9 8.3 After 9 Days Treatment Control 138.3 9.2 104 8.9 96.4 8.9 89 10.1 88 9.6 103.8 8.6 147.3 10.4 97.1 12.4 172.6 9.2 146.3 9.5 99 8.4 122.3 8.8 103 12.5 117.8 9.1 121.5 93 (a) Use the given data for the treatment group to determine if…arrow_forward
- Dyslexia refers to a specific reading disability that affects 10% to 15% of the general population. A dyslexic child is defined as a child of normal or above-normal intelligence with no known organic behavioural disorders who, despite normal schooling, shows a reading lag of at least two years. A researcher proposed that dyslexia was the result of a complex visual deficit that could be immediately corrected by simply putting a blue plastic overlay on the reading material. To test this, 100 dyslexic children were randomly assigned to one of two groups, one of which read from pages with a clear plastic overlay and the other of which read from pages with a blue plastic overlay. The dependent variable was percentage correct on a multiple-choice reading comprehension test. a) Is this an observational study or an experiment? Explain your choice. b) Why did the researcher use a clear overlay as one of the treatment groups instead of just having the children read the passage without an…arrow_forwardDyslexia refers to a specific reading disability that affects 10% to 15% of the general population. A dyslexic child is defined as a child of normal or above-normal intelligence with no known organic behavioural disorders who, despite normal schooling, shows a reading lag of at least two years. A researcher proposed that dyslexia was the result of a complex visual deficit that could be immediately corrected by simply putting a blue plastic overlay on the reading material. To test this, 100 dyslexic children were randomly assigned to one of two groups, one of which read from pages with a clear plastic overlay and the other of which read from pages with a blue plastic overlay. The dependent variable was percentage correct on a multiple-choice reading comprehension test. What assumptions for the hypothesis test would need to be conducted for a one sample t test? Which data on spss would i need to look at for the assumptions?arrow_forward
 Functions and Change: A Modeling Approach to Coll...AlgebraISBN:9781337111348Author:Bruce Crauder, Benny Evans, Alan NoellPublisher:Cengage Learning
 Glencoe Algebra 1, Student Edition, 9780079039897...AlgebraISBN:9780079039897Author:CarterPublisher:McGraw Hill