
Videos
The article “The Selection of Yeast Strains for the Production of Premium Quality South African Brandy Base Products” (C. Steger and M. Lambrechts, Journal of Industrial Microbiology and Biotechnology, 2000:431–440) presents detailed information on the volatile compound composition of base wines made from each of 16 selected yeast strains. Below are the concentrations of total esters and total volatile acids (in mg/L) in each of the wines.
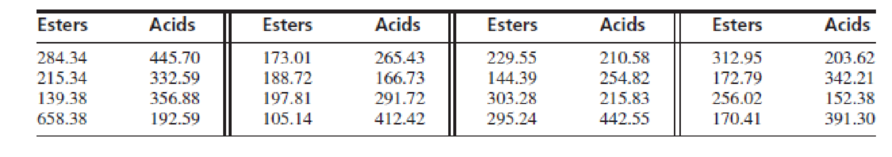
- a. Construct a
scatterplot of acid concentration versus ester concentration. Indicate the outlier. - b. Compute the coefficients of the least-squares line for predicting acid level (y) from ester level (x), along with their estimated standard deviations.
- c. Compute the P-value of the test of the null hypothesis H0 : β1 = 0.
- d. Delete the outlier, and recompute the coefficients of the least-squares line, along with their estimated standard deviations.
- e. Compute the P-value of the test of the null hypothesis H0 : β1 = 0 for the data with the outlier deleted.
- f. Does a linear model appear to be useful for predicting acid concentration from ester concentration? Explain.
Want to see the full answer?
Check out a sample textbook solution
Chapter 7 Solutions
Statistics for Engineers and Scientists (Looseleaf)
Additional Math Textbook Solutions
Stats: Modeling the World Nasta Edition Grades 9-12
Introduction to Statistical Quality Control
Elementary Statistics Using the TI-83/84 Plus Calculator, Books a la Carte Edition (4th Edition)
Statistics: The Art and Science of Learning from Data (4th Edition)
Introductory Statistics (10th Edition)


- PCBs and Pelicans. Polychlorinated biphenyls (PCBs), industrial pollutants, are known to be carcinogens and a great danger to natural ecosystems. As a result of several studies, PCB production was banned in the United States in 1979 and by the Stockholm Convention on Persistent Organic Pollutants in 2001. One study, published in 1972 by R. Risebrough, is titled “Effects of Environmental Pollutants Upon Animals Other Than Man” (Proceedings of the 6th Berkeley Symposium on Mathematics and Statistics, VI, University of California Press, pp. 443–463). In that study, 60 Anacapa pelican eggs were collected and measured for their shell thickness, in millimeters (mm), and concentration of PCBs, in parts per million (ppm). The data are on the WeissStats site. a. obtain and interpret the standard error of the estimate. b. obtain a residual plot and a normal probability plot of the residuals. c. decide whether you can reasonably consider Assumptions 1–3 for regression inferences met by the two…arrow_forward& The accompanying table gives plasma epinephrine concentration for ten experimental subjects during (1) isoflurane, (2) halothane, and (3) cyclopropane anesthesia ("Sympathoadrenal and Hemodynamic Effects of Isoflurane, Halothane, and Cyclopropane in Dogs." Anesthesiology, 1974: 465-470). a. Does the choice of anesthetic affect true average concentration? Test H: a, = a, = a, = 0 at level .05 after constructing the ANOVA table. %3D Subject (B) 2 3 4 5 .51 1.00 .39 28 .39 29 Anesthetic 38 .21 2 .30 3 1.07 1.35 .63 (A) .69 .28 1.24 6. 7 8 10 33 17 .32 .56 1.02 .69 .32 .39 1 .36 Anesthetic 2 .88 51 .42 (A) 3 1.53 49 .30 ΣΣή-13.7980arrow_forwardThe comparative boxplot (see below) of gasoline vapor coefficients for vehicles in Detroit appeared in the article "Receptor Modeling Approach to VOC Emission Inventory Validation" (J. of Envir. Engr., 1995: 483-490). Discuss any interesting features. Gas vapor coefficient 70 60 50 40 30 20 Time 6A.M. 8A.M. 12noon 2P.M. 10P.M. 10arrow_forward
- Samples of emissions from three suppliers are classified for conformance to air-quality specifications. The results from 100 samples are summarized as follows I need a step-by-step solution and an explanation. Thank you!arrow_forwardThe article "Estimating Population Abundance in Plant Species with Dormant Life-Stages: Fire and the Endangered Plant Grevillea caleye R Br." (T. Auld and J. Scott, Ecological Management and Restoration, 2004:125-129) presents estimates of population sizes of a certain rare shrub in areas burnt by fire. The following table presents population counts and areas (in m?) for several patches containing the plant. Агеа 3739 Population 3015 5277 1847 400 17 345 392 142 40 7000 2521 213 11958 1200 2878 707 113 1392 157 12000 10880 711 74 2259 223 81 15 33 18 1254 1320 229 351 1000 92 841 1720 1500 300 228 31 228 17 10 Compute the least-squares line for predicting population (y) from area (x). Б. a. Plot the residuals versus the fitted values. Does the model seem appropriate? Compute the least-squares line for predicting In y from In x. Plot the residuals versus the fitted values. Does the model seem appropriate? Using the more appropriate model, construct a 95% prediction interval for the…arrow_forwardConsider the figure shown indicating the results on an experiment growing a marine invertebrate in 4 different environments based on values of 2 factors. Two different temperatures and two different salinities were used. Which of the following best describes the effects of the two factors? A. The effect of low versus high temperature depends on the salinity. B. The effect of low versus high salinity depends on the temperature. C. There is no interaction D. The 2 factors interact synergisticallyarrow_forward
- A study measures the absorption rate of three different types of organic chemical solvents. These solvents are used to clean industrial fabricated-metal parts and are potentially hazardous. The organic chemical solvents are Aromatics, Chloroalkanes and Esters. Aromatics ChloroalkanEsters es 0.95 1.58 0.43 1.15 0.91 0.61 0.82 0.83 0.34 1.05 1.16 0.60 0.57 0.53 1.45 Test if there is a significance difference in the mean absorption rate for the three solvents? Use a = 0.05.arrow_forwardThe article "Oxidation State and Activities of Chromium Oxides in Cao-SiO,-CrO, Slag System" (Y. Xiao, L. Holappa, and M. Reuter, Metallurgical and Materials Transactions B, 2002:595-603) presents the amount x (in mole percent) and activity coefficient y of CrO,5 for several specimens. The data, extracted from a larger table, are presented in the following table. х У 2.6 10.20 5.03 19.9 8.84 0.8 6.62 5.3 2.89 20.3 2.31 39.4 7.13 5.8 3.40 29.4 5.57 2.2 7.23 5.5 2.12 33.1 1.67 44.2 5.33 13.1 16.70 0.6 9.75 2.2 2.74 16.9 2.58 35.5 1.50 48.0 Compute the least-squares line for predicting y from x. b. Plot the residuals versus the fitted values. Compute the least-squares line for predicting y from 1/x. d. Plot the residuals versus the fitted values. C. Using the better fitting line, find a 95% confidence interval for the mean value of y when x= 5.0.arrow_forward1. Soil samples were collected at two areas surrounding an abandoned mine and analyzed for lead. At each area several samples were taken. The soil was extracted with acid, and the extract was analyzed using flame atomic absorption spectrometry. In Area A, Pb concentrations were 1.2, 1.0, 0.9, 1.4 mg/kg. In Area B, Pb concentrations were 0.7, 1.0, 0.5, 0.6, 0.4 mg/kg. Are these two areas significantly different from each other with Pb concentrations at 90% confidence level?arrow_forward
- Meteoroids. In the article “Interstellar Pelting” (Scientific American, Vol. 288, No. 5, pp. 28–30), G. Musser explained that information on extrasolar planets can be discerned from foreign material and dust found in our solar system. Studies show that 1 in every 100 meteoroids entering Earth’s atmosphere is actually alien matter from outside our solar system. a. Of 300 meteoroids entering the Earth’s atmosphere, how many would you expect to be alien matter from outside our solar system? Justify your answer. b. Apply the Poisson approximation to the binomial distribution to determine the probability that, of 300 meteoroids entering the Earth’s atmosphere, between 2 and 4, inclusive, are alien matter from outside our solar system. c. Apply the Poisson approximation to the binomial distribution to determine the probability that, of 300 meteoroids entering the Earth’s atmosphere, at least 1 is alien matter from outside our solar system.arrow_forward14) Penicillin is produced by the Penicillin fungus, which is grown in a broth whose sugar be carefully controlled. Several samples of broth were taken on three successive days, and the amount of dissolved sugars, in milligrams per milliliter, was measured on each sample. The results were as follows.arrow_forwardThe compressive strength of concrete is being studied and four different mixing techniques are being investigated. The following data have been collected. Compressive Strength (psi) 1 3129 3000 2865 2890 Mixing Technique a.) What is the problem? b.) What are the hypotheses? 2 3200 3300 2975 3150 3 2800 2900 2985 3050 4 2600 2700 2600 2765 Test the hypothesis that mixing techniques affect the strength of the concrete. Use a = 0.05. c.) Using EXCEL, provide a screenshot of the results. d.) Conclusionarrow_forward
 MATLAB: An Introduction with ApplicationsStatisticsISBN:9781119256830Author:Amos GilatPublisher:John Wiley & Sons Inc
 Probability and Statistics for Engineering and th...StatisticsISBN:9781305251809Author:Jay L. DevorePublisher:Cengage Learning
 Statistics for The Behavioral Sciences (MindTap C...StatisticsISBN:9781305504912Author:Frederick J Gravetter, Larry B. WallnauPublisher:Cengage Learning
 Elementary Statistics: Picturing the World (7th E...StatisticsISBN:9780134683416Author:Ron Larson, Betsy FarberPublisher:PEARSON
 The Basic Practice of StatisticsStatisticsISBN:9781319042578Author:David S. Moore, William I. Notz, Michael A. FlignerPublisher:W. H. Freeman
 Introduction to the Practice of StatisticsStatisticsISBN:9781319013387Author:David S. Moore, George P. McCabe, Bruce A. CraigPublisher:W. H. Freeman