
Concept explainers
Videos
To construct: the appropriate model on the basis of given data.
Explanation of Solution
Given:
| Height | Pressure |
| 48 | 29.1 |
| 44 | 31.9 |
| 40 | 35.3 |
| 36 | 39.3 |
| 32 | 44.2 |
| 28 | 50.3 |
| 24 | 58.8 |
| 20 | 70.7 |
| 18 | 77.9 |
| 16 | 87.9 |
| 14 | 100.4 |
| 12 | 117.6 |
Graph:
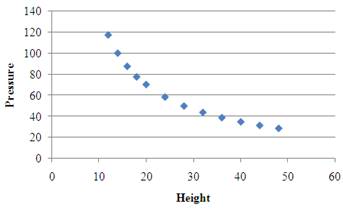
This scatter figure of data is to know about the relationship between the variables. It represents the association between the height of the cylinder and pressure inside the cylinder. Therefore, linear model would not be fit into the data well.
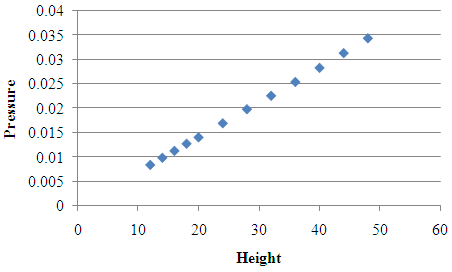
| Height | 1/Pressure |
| 48 | 0.034364261 |
| 44 | 0.031347962 |
| 40 | 0.028328612 |
| 36 | 0.025445293 |
| 32 | 0.022624434 |
| 28 | 0.019880716 |
| 24 | 0.017006803 |
| 20 | 0.014144272 |
| 18 | 0.01283697 |
| 16 | 0.011376564 |
| 14 | 0.009960159 |
| 12 | 0.008503401 |
Again plotting the graph
Regression output of the estimated table
| Coefficients | Standard Error | t Stat | P-value | Lower 95% | Upper 95% | Lower 95.0% | Upper 95.0% | |
| Intercept | -7.6697E-05 | 7.81321E-05 | -0.981632891 | 0.349433095 | -0.000250786 | 9.73921E-05 | -0.000250786 | 9.73921E-05 |
| X Variable 1 | 0.000713072 | 2.59959E-06 | 274.3012033 | 1.0199E-20 | 0.000707279 | 0.000718864 | 0.000707279 | 0.000718864 |
Therefore the required equation from the above of the regression equation
R-squared of the model is, about 100 percent which implies 100 percent of variability in the reciprocal of pressure is estimated for by the model.
Chapter 10 Solutions
Stats: Modeling the World Nasta Edition Grades 9-12
Additional Math Textbook Solutions
Introductory Statistics
Introductory Statistics (10th Edition)
Intro Stats
Statistical Reasoning for Everyday Life (5th Edition)
Elementary Statistics: Picturing the World (6th Edition)
Basic Business Statistics, Student Value Edition (13th Edition)


 MATLAB: An Introduction with ApplicationsStatisticsISBN:9781119256830Author:Amos GilatPublisher:John Wiley & Sons Inc
 Probability and Statistics for Engineering and th...StatisticsISBN:9781305251809Author:Jay L. DevorePublisher:Cengage Learning
 Statistics for The Behavioral Sciences (MindTap C...StatisticsISBN:9781305504912Author:Frederick J Gravetter, Larry B. WallnauPublisher:Cengage Learning
 Elementary Statistics: Picturing the World (7th E...StatisticsISBN:9780134683416Author:Ron Larson, Betsy FarberPublisher:PEARSON
 The Basic Practice of StatisticsStatisticsISBN:9781319042578Author:David S. Moore, William I. Notz, Michael A. FlignerPublisher:W. H. Freeman
 Introduction to the Practice of StatisticsStatisticsISBN:9781319013387Author:David S. Moore, George P. McCabe, Bruce A. CraigPublisher:W. H. Freeman