
Concept explainers
Videos
To construct: the linear model for this relationship and disclosing any problems that the model might have.
Explanation of Solution
Given:
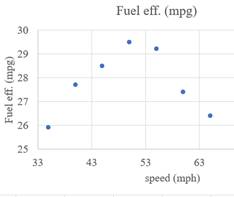
| speed (mph) | Fuel eff. (mpg) |
| 35 | 25.9 |
| 40 | 27.7 |
| 45 | 28.5 |
| 50 | 29.5 |
| 55 | 29.2 |
| 60 | 27.4 |
| 65 | 26.4 |
| 70 | 24.2 |
| 75 | 22.8 |
Graph:
Scatter Plot:
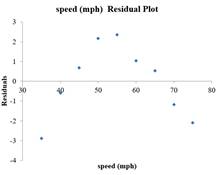
Residual plot:
Data analysis
Data > Data analysis > Regression
Step 1. Enter data in excel spreadsheet
Step 2. Click on Data > Data analysis > Regression.
Step 3. Select input Y and X
Step 4. Click Ok
This is the obtained output
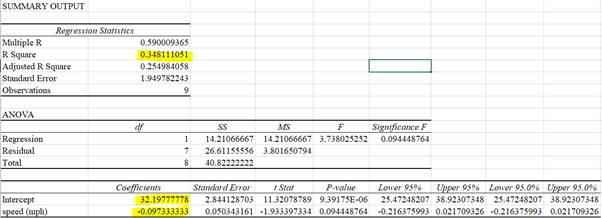
The regression from this output given as
Chapter 10 Solutions
Stats: Modeling the World Nasta Edition Grades 9-12
Additional Math Textbook Solutions
Elementary Statistics: Picturing the World (7th Edition)
Elementary Statistics
Statistics for Psychology
Basic Business Statistics, Student Value Edition (13th Edition)
Introductory Statistics
Elementary Statistics Using Excel (6th Edition)


 MATLAB: An Introduction with ApplicationsStatisticsISBN:9781119256830Author:Amos GilatPublisher:John Wiley & Sons Inc
 Probability and Statistics for Engineering and th...StatisticsISBN:9781305251809Author:Jay L. DevorePublisher:Cengage Learning
 Statistics for The Behavioral Sciences (MindTap C...StatisticsISBN:9781305504912Author:Frederick J Gravetter, Larry B. WallnauPublisher:Cengage Learning
 Elementary Statistics: Picturing the World (7th E...StatisticsISBN:9780134683416Author:Ron Larson, Betsy FarberPublisher:PEARSON
 The Basic Practice of StatisticsStatisticsISBN:9781319042578Author:David S. Moore, William I. Notz, Michael A. FlignerPublisher:W. H. Freeman
 Introduction to the Practice of StatisticsStatisticsISBN:9781319013387Author:David S. Moore, George P. McCabe, Bruce A. CraigPublisher:W. H. Freeman