
Concept explainers
Videos
(a)
To explain: the fit of a linear model to these data and what problems the model has.
(a)
Explanation of Solution
Given:
| Age | Diameter |
| 2 | 2.1 |
| 4 | 3.9 |
| 6 | 5.2 |
| 8 | 6.2 |
| 10 | 6.9 |
| 12 | 7.6 |
| 14 | 8.3 |
| 16 | 9.1 |
| 18 | 10 |
| 20 | 11.4 |
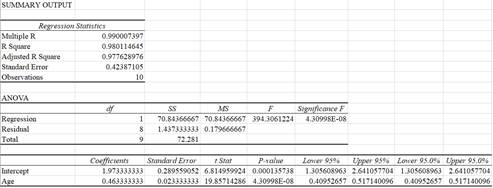
Calculation:
Data analysis
Data > Data analysis > Regression
Step 1. Enter data in excel spreadsheet
Step 2. Click on Data > Data analysis > Regression.
Step 3. Select input Y and X
Step 4. Click Ok
This is the obtained output
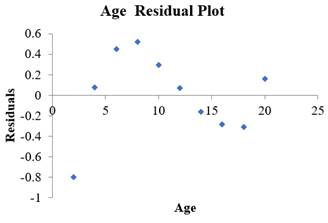
Graph:
Residual Plot:
From the given output the regression line is
(b)
To explain: expect the fit on the basis of the data given to be better, less powerful or about the same.
(b)
Explanation of Solution
If individual trees were given diameters, rather than averages, the
Chapter 10 Solutions
Stats: Modeling the World Nasta Edition Grades 9-12
Additional Math Textbook Solutions
An Introduction to Mathematical Statistics and Its Applications (6th Edition)
Statistical Reasoning for Everyday Life (5th Edition)
Intro Stats, Books a la Carte Edition (5th Edition)
Essentials of Statistics, Books a la Carte Edition (5th Edition)
Introductory Statistics (10th Edition)


 MATLAB: An Introduction with ApplicationsStatisticsISBN:9781119256830Author:Amos GilatPublisher:John Wiley & Sons Inc
 Probability and Statistics for Engineering and th...StatisticsISBN:9781305251809Author:Jay L. DevorePublisher:Cengage Learning
 Statistics for The Behavioral Sciences (MindTap C...StatisticsISBN:9781305504912Author:Frederick J Gravetter, Larry B. WallnauPublisher:Cengage Learning
 Elementary Statistics: Picturing the World (7th E...StatisticsISBN:9780134683416Author:Ron Larson, Betsy FarberPublisher:PEARSON
 The Basic Practice of StatisticsStatisticsISBN:9781319042578Author:David S. Moore, William I. Notz, Michael A. FlignerPublisher:W. H. Freeman
 Introduction to the Practice of StatisticsStatisticsISBN:9781319013387Author:David S. Moore, George P. McCabe, Bruce A. CraigPublisher:W. H. Freeman