
Concept explainers
Videos
(a)
To Explain: the reason for the linear model is not appropriate for using the length in the inch for the pendulum to expect the number of swings in 20 sec.
(a)
Explanation of Solution
Given:
| Length (in) | Number of Swings |
| 6.5 | 22 |
| 9 | 20 |
| 11.5 | 17 |
| 14.5 | 16 |
| 18 | 14 |
| 21 | 13 |
| 24 | 13 |
| 27 | 12 |
| 30 | 11 |
| 37.5 | 10 |
Graph:
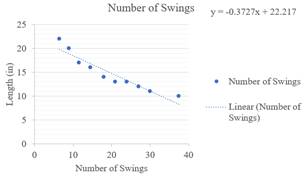
Calculation:
The regression equation is
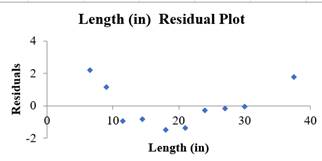
By seeing the shape of the residual plot, it can be estimated that the there curve in the figure, therefore the linear model is not suitable.
(b)
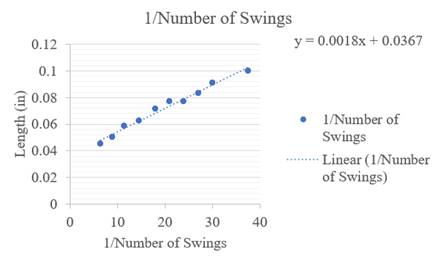
To conduct: the re-express the data list to be straighten for the
(b)
Explanation of Solution
Graph:
Residual plot
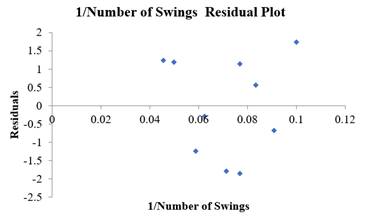
It may say from the above plot that this is a suitable model to fit, as the residuals are scattered. It may say from this that the reciprocal number of swings linearizes the plot.
(c)
To construct: an appropriate model.
(c)
Explanation of Solution
This is the appropriate model for the given data
(d)
To calculate: the number of swings for the pendulum of 4-inch string.
(d)
Answer to Problem 16E
22.8624
Explanation of Solution
Given:
Formula used:
Calculation:
(e)
To calculate: the number of swings for a 48-inch string pendulum.
(e)
Answer to Problem 16E
8.2522
Explanation of Solution
Given:
Formula used:
Calculation:
(f)
To explain: the confidence does place in this prediction.
(f)
Explanation of Solution
Because
Chapter 10 Solutions
Stats: Modeling the World Nasta Edition Grades 9-12
Additional Math Textbook Solutions
Elementary Statistics: Picturing the World (7th Edition)
Introductory Statistics (10th Edition)
Introductory Statistics (2nd Edition)
Statistical Reasoning for Everyday Life (5th Edition)
Intro Stats, Books a la Carte Edition (5th Edition)
Introductory Statistics


 MATLAB: An Introduction with ApplicationsStatisticsISBN:9781119256830Author:Amos GilatPublisher:John Wiley & Sons Inc
 Probability and Statistics for Engineering and th...StatisticsISBN:9781305251809Author:Jay L. DevorePublisher:Cengage Learning
 Statistics for The Behavioral Sciences (MindTap C...StatisticsISBN:9781305504912Author:Frederick J Gravetter, Larry B. WallnauPublisher:Cengage Learning
 Elementary Statistics: Picturing the World (7th E...StatisticsISBN:9780134683416Author:Ron Larson, Betsy FarberPublisher:PEARSON
 The Basic Practice of StatisticsStatisticsISBN:9781319042578Author:David S. Moore, William I. Notz, Michael A. FlignerPublisher:W. H. Freeman
 Introduction to the Practice of StatisticsStatisticsISBN:9781319013387Author:David S. Moore, George P. McCabe, Bruce A. CraigPublisher:W. H. Freeman