
Videos
(a)
To construct: the linear model for the weight lifted in every weight class.
(a)
Explanation of Solution
Given:
| Weight class | Weight Lifted |
| 56 | 295 |
| 62 | 325 |
| 69 | 347.5 |
| 77 | 375 |
| 85 | 382.5 |
| 94 | 407.5 |
| 105 | 425 |
Calculation:
Creating the model below is the output the given input
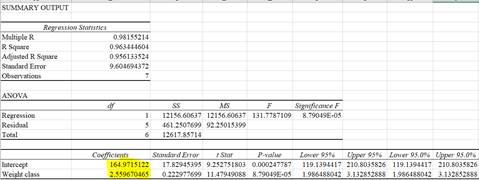
Graph:
From the above output the regression line would be
(b)
To check: residual plot and tell about the linear model is appropriate or not.
(b)
Explanation of Solution
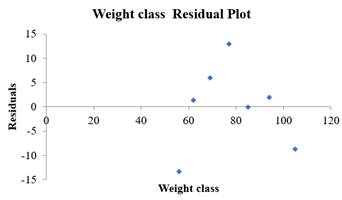
Graph:
Residual output of the model is
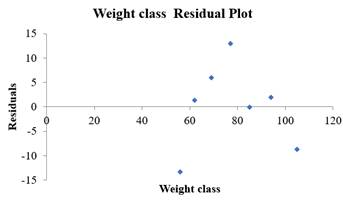
By seeing the residual output, it seems that it is curvature in the nature, therefore linear
(c)
To construct: the better model.
(c)
Explanation of Solution
Given:
| Weight class | Weight Lifted |
| 56 | 295 |
| 62 | 325 |
| 69 | 347.5 |
| 77 | 375 |
| 85 | 382.5 |
| 94 | 407.5 |
| 105 | 425 |
Calculation:
Re-expressing the data using the reciprocal of the class
| Weight class | Weight Lifted | 1/weight class |
| 56 | 295 | 0.017857143 |
| 62 | 325 | 0.016129032 |
| 69 | 347.5 | 0.014492754 |
| 77 | 375 | 0.012987013 |
| 85 | 382.5 | 0.011764706 |
| 94 | 407.5 | 0.010638298 |
| 105 | 425 | 0.00952381 |
Graph:
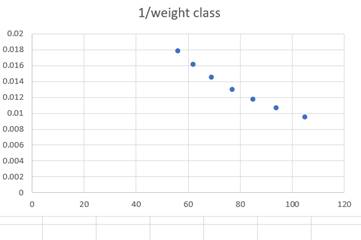
By seeing the scatter plot it seem that equation line looks similar, negative and strong.
(d)
To Explain: the reason for the better of new model.
(d)
Explanation of Solution
Given:
Re-expressing the data using the reciprocal of the class
| Weight class | Weight Lifted | 1/weight class |
| 56 | 295 | 0.017857143 |
| 62 | 325 | 0.016129032 |
| 69 | 347.5 | 0.014492754 |
| 77 | 375 | 0.012987013 |
| 85 | 382.5 | 0.011764706 |
| 94 | 407.5 | 0.010638298 |
| 105 | 425 | 0.00952381 |
Graph:
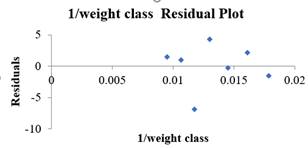
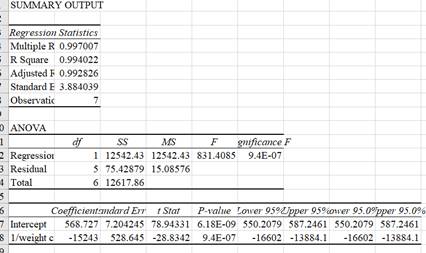
A better model than the original prototype is the reciprocal model. This model's plot of residualsThen the prior residual plot shows no pattern. And the model accounts for 99.4% of theWeight lift variability, which is considerably higher than the previous iteration.
(e)
To explain:the which of the medallists turned in the most surprising performance.
(e)
Answer to Problem 24E
Georgia
Explanation of Solution
By seeing the residual plot it is much clear that Georgia is having the highest negative residual which is most lifted lesser weight than expected by him.
Chapter 10 Solutions
Stats: Modeling the World Nasta Edition Grades 9-12
Additional Math Textbook Solutions
Statistics for Psychology
Introductory Statistics
Basic Business Statistics, Student Value Edition (13th Edition)
Basic Business Statistics, Student Value Edition


 MATLAB: An Introduction with ApplicationsStatisticsISBN:9781119256830Author:Amos GilatPublisher:John Wiley & Sons Inc
 Probability and Statistics for Engineering and th...StatisticsISBN:9781305251809Author:Jay L. DevorePublisher:Cengage Learning
 Statistics for The Behavioral Sciences (MindTap C...StatisticsISBN:9781305504912Author:Frederick J Gravetter, Larry B. WallnauPublisher:Cengage Learning
 Elementary Statistics: Picturing the World (7th E...StatisticsISBN:9780134683416Author:Ron Larson, Betsy FarberPublisher:PEARSON
 The Basic Practice of StatisticsStatisticsISBN:9781319042578Author:David S. Moore, William I. Notz, Michael A. FlignerPublisher:W. H. Freeman
 Introduction to the Practice of StatisticsStatisticsISBN:9781319013387Author:David S. Moore, George P. McCabe, Bruce A. CraigPublisher:W. H. Freeman