
Concept explainers
Videos
(a)
To Explain: the reason of linear model is not appropriate.
(a)
Explanation of Solution
Given:
| Speed (mph) | Stopping Distances (ft) |
| 20 | 64, 62, 59 |
| 30 | 114, 118, 105 |
| 40 | 153, 171, 165 |
| 50 | 231, 203, 238 |
| 60 | 317, 321, 276 |
Graph:
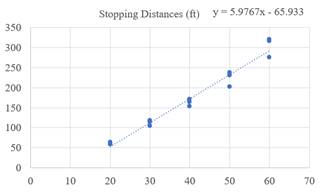
Suppose that both the explanatory variable and the response variable are speed (mph) and stopping distance (ft). The linearity of the scatter plot is too much simpler to describe. The scatter graph is built on the basis of the given data. It is very difficult to determine the linearity by seeing the scatter graph. Now check the linearity using the residual graph
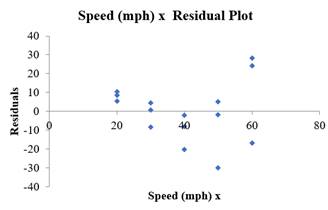
By seeing the shape of the drawn plot, there is curved pattern, which is violating the straight the sufficient condition. Therefore, the linear equation
(b)
To find: the re-express the data to straighten the scatter plot.
(b)
Explanation of Solution
Given:
| Speed (mph) | Stopping Distances (ft) |
| 20 | 64, 62, 59 |
| 30 | 114, 118, 105 |
| 40 | 153, 171, 165 |
| 50 | 231, 203, 238 |
| 60 | 317, 321, 276 |
Calculation:
In Part (a), it can observe that there is no linearity in the results. It is important to make it linear in order toTransform the data for the Stopping Distance response variable into a square root form. Then there's the
SQRT (Stopping Distance) appears like a new response variable.
Below, the data is mention:
| Speed (mph) x | Stopping Distances (ft) | sqrt (Stopping Distances) |
| 20 | 64 | 8 |
| 20 | 62 | 7.874007874 |
| 20 | 59 | 7.681145748 |
| 30 | 114 | 10.67707825 |
| 30 | 118 | 10.86278049 |
| 30 | 105 | 10.24695077 |
| 40 | 153 | 12.36931688 |
| 40 | 171 | 13.07669683 |
| 40 | 165 | 12.84523258 |
| 50 | 231 | 15.19868415 |
| 50 | 203 | 14.24780685 |
| 50 | 238 | 15.42724862 |
| 60 | 317 | 17.80449381 |
| 60 | 321 | 17.91647287 |
| 60 | 276 | 16.61324773 |
Graph:
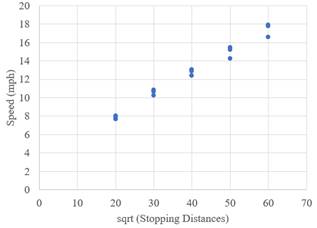
It may conclude from the scatter plot that this is a good model to fit in. it can tell from this, the square root of the distance linearizes the diagram.
(c)
To construct: the appropriate model.
(c)
Answer to Problem 15E
Explanation of Solution
| Speed (mph) | Stopping Distances (ft) |
| 20 | 64, 62, 59 |
| 30 | 114, 118, 105 |
| 40 | 153, 171, 165 |
| 50 | 231, 203, 238 |
| 60 | 317, 321, 276 |
Calculation:
| Coefficients | Standard Error | t Stat | |
| Intercept | 3.303404005 | 0.347689827 | 9.501008521 |
| Speed (mph) x | 0.235483506 | 0.008195128 | 28.73457391 |
| Regression Statistics | |
| Multiple R | 0.992219418 |
| R Square | 0.984499373 |
| Adjusted R Square | 0.983307017 |
| Standard Error | 0.448865636 |
| Observations | 15 |
Predicted regression equation
(d)
To Calculate:the stopping distance for a car travelling 55 mph.
(d)
Answer to Problem 15E
263.251
Explanation of Solution
Given:
Formula used:
Calculation:
(e)
To Calculate:the stopping distance for a car travelling 70 mph.
(e)
Explanation of Solution
Given:
Formula used:
Calculation:
(f)
To find: the confidence that place in these predictions.
(f)
Explanation of Solution
The results got in part (c), the coefficient of determination is
Chapter 10 Solutions
Stats: Modeling the World Nasta Edition Grades 9-12
Additional Math Textbook Solutions
Elementary Statistics (13th Edition)
Elementary Statistics: Picturing the World (6th Edition)
Basic Business Statistics, Student Value Edition (13th Edition)
Statistical Reasoning for Everyday Life (5th Edition)
Basic Business Statistics, Student Value Edition


 MATLAB: An Introduction with ApplicationsStatisticsISBN:9781119256830Author:Amos GilatPublisher:John Wiley & Sons Inc
 Probability and Statistics for Engineering and th...StatisticsISBN:9781305251809Author:Jay L. DevorePublisher:Cengage Learning
 Statistics for The Behavioral Sciences (MindTap C...StatisticsISBN:9781305504912Author:Frederick J Gravetter, Larry B. WallnauPublisher:Cengage Learning
 Elementary Statistics: Picturing the World (7th E...StatisticsISBN:9780134683416Author:Ron Larson, Betsy FarberPublisher:PEARSON
 The Basic Practice of StatisticsStatisticsISBN:9781319042578Author:David S. Moore, William I. Notz, Michael A. FlignerPublisher:W. H. Freeman
 Introduction to the Practice of StatisticsStatisticsISBN:9781319013387Author:David S. Moore, George P. McCabe, Bruce A. CraigPublisher:W. H. Freeman