
Concept explainers
Videos
(a)
To Explain: the association between these variables given in the scatter plot.
(a)
Explanation of Solution
Given:
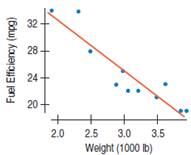
By seeing the graph, it observed that the scatter plot, vertical axis displays the fuel efficiency and the horizontal axis displays the weight. As the weight is increasing the efficiency of the fuel is decreases. There is strong negative association between these two variables and it is fairly linear.
(b)
To find: the
(b)
Explanation of Solution
Given:
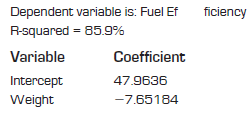
By seeing the given output the slope of the line is -7.65184. It tells that gas mileage decreases an average 7.652 mpg for the each thousand pound of weight.
(c)
To find: that this linear model is appropriate or not.
(c)
Explanation of Solution
Given:
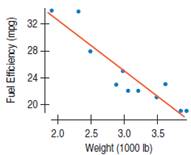
By seeing the plot, it noticed that the pattern is curved. The linear model is appropriate only if the residual figure does not display any pattern. So, the linear model is not appropriate. Therefore the linear model is not appropriate, although residual figure display a curved pattern.
Chapter 10 Solutions
Stats: Modeling the World Nasta Edition Grades 9-12
Additional Math Textbook Solutions
Elementary Statistics
Basic Business Statistics, Student Value Edition
Statistics for Psychology
Basic Business Statistics, Student Value Edition (13th Edition)
Elementary Statistics Using Excel (6th Edition)


 MATLAB: An Introduction with ApplicationsStatisticsISBN:9781119256830Author:Amos GilatPublisher:John Wiley & Sons Inc
 Probability and Statistics for Engineering and th...StatisticsISBN:9781305251809Author:Jay L. DevorePublisher:Cengage Learning
 Statistics for The Behavioral Sciences (MindTap C...StatisticsISBN:9781305504912Author:Frederick J Gravetter, Larry B. WallnauPublisher:Cengage Learning
 Elementary Statistics: Picturing the World (7th E...StatisticsISBN:9780134683416Author:Ron Larson, Betsy FarberPublisher:PEARSON
 The Basic Practice of StatisticsStatisticsISBN:9781319042578Author:David S. Moore, William I. Notz, Michael A. FlignerPublisher:W. H. Freeman
 Introduction to the Practice of StatisticsStatisticsISBN:9781319013387Author:David S. Moore, George P. McCabe, Bruce A. CraigPublisher:W. H. Freeman