
Concept explainers
Videos
Construct the ANOVA table and test for significance at 5% level.
Answer to Problem 58SE
The ANOVA table is given below:
| Source |
Degrees of freedom |
Sum of squares |
Mean sum of squares | F-ratio |
|
Vat pressure A | 1 | 6.94 | 6.94 | 11.57 |
|
Cooking time B | 3 | 5.61 | 1.87 | 3.12 |
|
Concentration C | 2 | 12.33 | 6.165 | 10.28 |
| Interaction AB | 3 | 4.05 | 1.35 | 2.25 |
| Interaction BC | 6 | 15.80 | 2.63 | 4.38 |
| Interaction AC | 2 | 7.32 | 3.66 | 6.10 |
| Interaction ABC | 6 | 4.37 | 0.728 | 1.21 |
| Error | 24 | 14.40 | 0.6 | |
| Total | 47 | 70.82 |
There is sufficient of evidence to conclude that there is an effect of vat pressure on the strength of the paper at 5% level of significance.
There is sufficient of evidence to conclude that there is an effect of cooking times on the strength of the paper at 5% level of significance.
There is sufficient of evidence to conclude that there is an effect of concentrations on the strength of the paper at 5% level of significance.
There is no sufficient of evidence to conclude that there is an interaction effect of vat pressure and cooking times on the strength of the paper at 5% level of significance.
There is sufficient of evidence to conclude that there is an interaction effect of cooking times and concentrations on the strength of the paper at 5% level of significance.
There is sufficient of evidence to conclude that there is an interaction effect of vat pressure and concentrations on the strength of the paper at 5% level of significance.
There is no sufficient of evidence to conclude that there is an interaction effect of vat pressure and concentrations on the strength of the paper at 5% level of significance.
Explanation of Solution
Given info:
An experiment was carried out to test the vat pressure A, cooking time of pulp B and hardwood concentration C on the strength of the paper.
The sum of squares of factor A is 6.94, due to factor B is 5.61, due to factor C is 12.33, due to interaction AB is 4.05, due to interaction BC is 15.80, due to interaction AC is 7.32, sum of squares due to error and total sum of squares is 14.40 and 70.82.
Two observations were made at each combination of factor levels.
Calculation:
The sum of squares due to the interaction of factor A, B and C is calculated as follows:
The general ANOVA table is given below:
| Source | Degrees of freedom | Sum of squares | Mean sum of squares | F-ratio |
| Factor A | ||||
| Factor B | ||||
| Factor C | ||||
| Interaction AB | ||||
| Error | ||||
| Total |
The ANOVA for the given data is shown below:
| Source | Degrees of freedom |
Sum of squares | Mean sum of squares | F-ratio |
|
Vat pressure A | 6.94 | 11.57 | ||
|
Cooking time B | 5.61 | 3.12 | ||
|
Concentration C | 12.33 | 10.28 | ||
| Interaction AB | 4.05 | 2.25 | ||
| Interaction BC | 15.80 | 4.38 | ||
| Interaction AC | 7.32 | 6.10 | ||
| Interaction ABC | 4.37 | 1.21 | ||
| Error | 14.40 | |||
| Total | 70.82 |
Where, the F statistic for each factor is obtained by dividing the mean sum of squares with the mean error sum of squares (MSE).
Testing the Hypothesis for the main effect A:
Null hypothesis:
That is, there is no significant difference in the strength of the paper due to the two levels of vat pressure.
Alternative hypothesis:
That is, there is significant difference in the strength of the paper due to the two levels of vat pressure.
Testing the Hypothesis for the main effect B:
Null hypothesis:
That is, there is no significant difference in the strength of the paper due to the four levels of cooking times.
Alternative hypothesis:
That is, there is significant difference in the strength of the paper due to the four levels of cooking times.
Testing the Hypothesis for the main effect C:
Null hypothesis:
That is, there is no significant difference in the strength of the paper due to the three levels of concentrations.
Alternative hypothesis:
That is, there is a significant difference in the strength of the paper due to the three levels of concentrations.
Testing the Hypothesis for the interaction effect of AB:
Null hypothesis:
That is, there is no significant difference in the strength due to the interaction between vat pressure and cooking times.
Alternative hypothesis:
That is, there is significant difference in the strength due to the interaction between vat pressure and cooking times.
Testing the Hypothesis for the interaction effect BC:
Null hypothesis:
That is, there is no significant difference in the strength due to the interaction between cooking times and concentrations.
Alternative hypothesis:
That is, there is significant difference in the strength due to the interaction between cooking times and concentrations.
Testing the Hypothesis for the interaction effect AC:
Null hypothesis:
That is, there is no significant difference in the strength of the paper due to the interaction between vat pressure and concentrations.
Alternative hypothesis:
That is, there is a significant difference in the strength of the paper due to the interaction between vat pressure and concentrations.
Testing the Hypothesis for the interaction effect ABC:
Null hypothesis:
That is, there is no significant difference in the strength of the paper due to the interaction between vat pressure, cooking times and concentrations.
Alternative hypothesis:
That is, there is a significant difference in the strength of the paper due to the interaction between vat pressure, cooking times and concentrations.
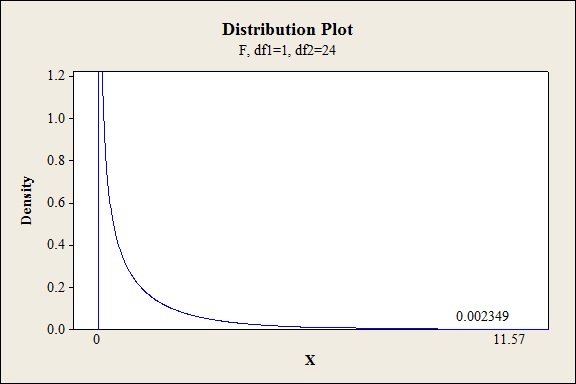
P-value for the main effect of A:
Software procedure:
Step-by-step procedure to find the P-value is given below:
- Click on Graph, select View Probability and click OK.
- Select F, enter 1 in numerator df and 24 in denominator df.
- Under Shaded Area Tab select X value under Define Shaded Area By and select right tail.
- Choose X value as 11.57.
- Click OK.
Output obtained from MINITAB is given below:
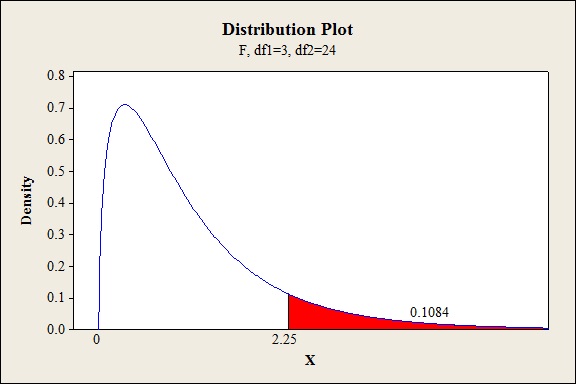
P-value for the main effect of B:
Software procedure:
Step-by-step procedure to find the P-value is given below:
- Click on Graph, select View Probability and click OK.
- Select F, enter 3 in numerator df and 24 in denominator df.
- Under Shaded Area Tab select X value under Define Shaded Area By and select right tail.
- Choose X value as 3.12.
- Click OK.
Output obtained from MINITAB is given below:
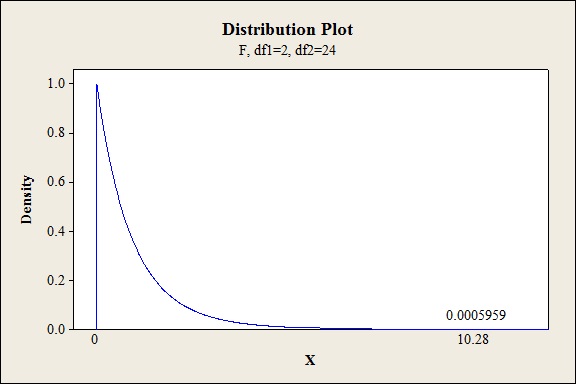
P-value for the main effect of C:
Software procedure:
Step-by-step procedure to find the P-value is given below:
- Click on Graph, select View Probability and click OK.
- Select F, enter 2 in numerator df and 24 in denominator df.
- Under Shaded Area Tab select X value under Define Shaded Area By and select right tail.
- Choose X value as 10.28.
- Click OK.
Output obtained from MINITAB is given below:
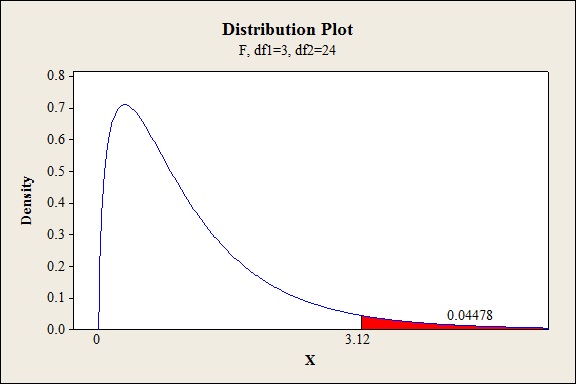
P-value for the interaction effect of AB:
Software procedure:
Step-by-step procedure to find the P-value is given below:
- Click on Graph, select View Probability and click OK.
- Select F, enter 3 in numerator df and 24 in denominator df.
- Under Shaded Area Tab select X value under Define Shaded Area By and select right tail.
- Choose X value as 2.25.
- Click OK.
Output obtained from MINITAB is given below:
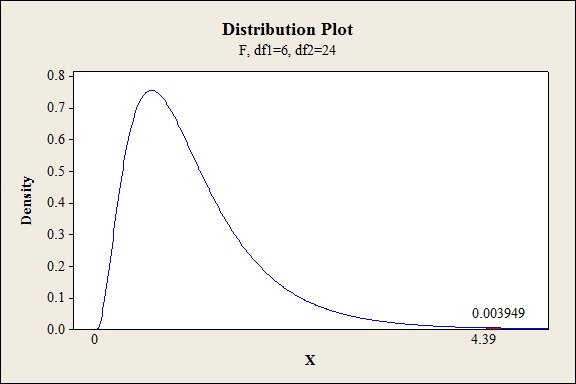
P-value for the interaction effect of BC:
Software procedure:
Step-by-step procedure to find the P-value is given below:
- Click on Graph, select View Probability and click OK.
- Select F, enter 6 in numerator df and 24 in denominator df.
- Under Shaded Area Tab select X value under Define Shaded Area By and select right tail.
- Choose X value as 4.39.
- Click OK.
Output obtained from MINITAB is given below:
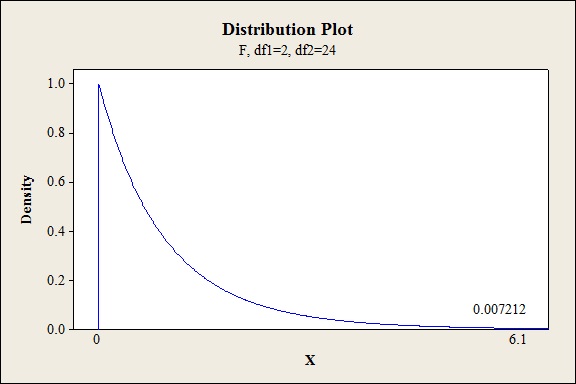
P-value for the interaction effect of AC:
Software procedure:
Step-by-step procedure to find the P-value is given below:
- Click on Graph, select View Probability and click OK.
- Select F, enter 2 in numerator df and 24 in denominator df.
- Under Shaded Area Tab select X value under Define Shaded Area By and select right tail.
- Choose X value as 6.10.
- Click OK.
Output obtained from MINITAB is given below:
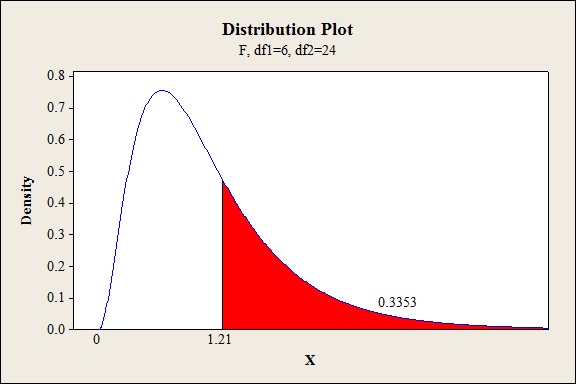
P-value for the interaction effect of ABC:
Software procedure:
Step-by-step procedure to find the P-value is given below:
- Click on Graph, select View Probability and click OK.
- Select F, enter 6 in numerator df and 24 in denominator df.
- Under Shaded Area Tab select X value under Define Shaded Area By and select right tail.
- Choose X value as 1.21.
- Click OK.
Output obtained from MINITAB is given below:
Conclusion:
For the main effect of A:
The P- value for the factor A (vat pressure) is 0.002 and the level of significance is 0.05.
Here, the P- value is lesser than the level of significance.
That is,
Thus, the null hypothesis is rejected,
Hence, there is sufficient of evidence to conclude that there is an effect of vat pressure on the strength of the paper at 5% level of significance.
For main effect of B:
The P- value for the factor B (cooking times) is 0.044 and the level of significance is 0.05.
Here, the P- value is lesser than the level of significance.
That is,
Thus, the null hypothesis is rejected.
Hence, there is sufficient of evidence to conclude that there is an effect of cooking times on the strength of the paper at 5% level of significance.
For main effect of C:
The P- value for the factor C (concentrations) is 0.000 and the level of significance is 0.05.
Here, the P- value is lesser than the level of significance.
That is,
Thus, the null hypothesis is rejected.
Hence, there is sufficient of evidence to conclude that there is an effect of concentrations on the strength of the paper at 5% level of significance.
For the interaction effect of AB:
The P- value for the interaction effect AB (vat pressure and cooking times) is 0.1084 and the level of significance is 0.05.
Here, the P- value is greater than the level of significance.
That is,
Thus, the null hypothesis is not rejected,
Hence, there is no sufficient of evidence to conclude that there is an interaction effect of vat pressure and cooking times on the strength of the paper at 5% level of significance.
For the interaction effect of BC
The P- value for the interaction effect BC (cooking times and concentrations) is 0.004 and the level of significance is 0.05.
Here, the P- value is lesser than the level of significance.
That is,
Thus, the null hypothesis is rejected,
Hence, there is sufficient of evidence to conclude that there is an interaction effect of cooking times and concentrations on the strength of the paper at 5% level of significance.
For the interaction effect of AC:
The P- value for the interaction effect AC (vat pressure and concentrations) is 0.0072 and the level of significance is 0.05.
Here, the P- value is lesser than the level of significance.
That is,
Thus, the null hypothesis is rejected,
Hence, there is sufficient of evidence to conclude that there is an interaction effect of vat pressure and concentrations on the strength of the paper at 5% level of significance.
For the interaction effect of ABC:
The P- value for the interaction effect ABC (vat pressure, cooking times and concentrations) is 0.3353 and the level of significance is 0.05.
Here, the P- value is greater than the level of significance.
That is,
Thus, the null hypothesis is not rejected,
Hence, there is no sufficient of evidence to conclude that there is an interaction effect of vat pressure, cooking times and concentrations on the strength of the paper at 5% level of significance.
The main effect A, B and C appears to be significant at 5% level. The interactions BC and AC are significant at 5% level of significance and the interactions AB and ABC are not significant at 5% level of significance.
Want to see more full solutions like this?
Chapter 11 Solutions
Probability and Statistics for Engineering and the Sciences


 Glencoe Algebra 1, Student Edition, 9780079039897...AlgebraISBN:9780079039897Author:CarterPublisher:McGraw Hill
 Algebra & Trigonometry with Analytic GeometryAlgebraISBN:9781133382119Author:SwokowskiPublisher:Cengage
 Linear Algebra: A Modern IntroductionAlgebraISBN:9781285463247Author:David PoolePublisher:Cengage Learning
