
Concept explainers
Videos
a.
To describe the overall shape of the distribution of monthly returns for the U.S. stock market over a 273-month period.
a.
Answer to Problem 71E
The distribution is skewed to the left and the distribution appears to contain 3 outliers with 2 gaps.
Explanation of Solution
The figure below shows a histogram of the distribution of monthly returns for the U.S. stock market over a 273-month period:

The distribution is skewed to the left, because the highest bars are to the right in the histogram with a tail of smaller bars to the left.
The distribution appears to contain 3 outliers, because there are two bars (one with frequency 2 and the other with frequency 1) which are separated by a gap from the other bars of the histogram.
The gaps are roughly at -20 and -13, while there are two potential outliers between -25 and -22.5, with one other potential outlier between -17.5 and -15.
b.
To determine the approximate center of this distribution of monthly returns for the U.S. stock market over a 273-month period.
b.
Answer to Problem 71E
The center of this distribution to be between 0% and 2.5%.
Explanation of Solution
The figure below shows a histogram of the distribution of monthly returns for the U.S. stock market over a 273-month period:
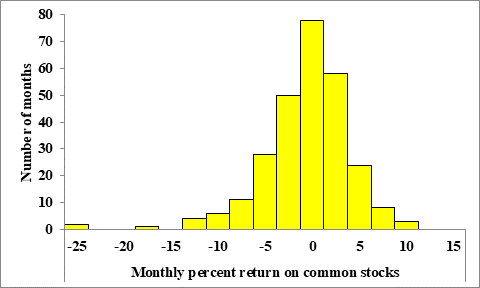
We expect the center of the distribution to be roughly at the highest bar in the histogram.
The highest bar has monthly percent returns between 0% and 2.5%, thus we then estimate the center of this distribution to be between 0% and 2.5%.
c.
To determine why we cannot find the exact value for the minimum return and between what two values does it lie.
c.
Answer to Problem 71E
We cannot determine the exact value of the minimum return, because we have not been given its exact value and we only know a
The minimum return is between -25% and -22.5%.
Explanation of Solution
The figure below shows a histogram of the distribution of monthly returns for the U.S. stock market over a 273-month period:

The minimum return is represented by the left most bar in the histogram.
However, we cannot determine the exact value of the minimum return, because we have not been given its exact value and we only know a range of possible values for the minimum return by the corresponding bar in the histogram.
We note that the leftmost bar in the histogram takes on monthly percent returns on common stocks between -25% and -22.5%, which then implies that the minimum return is between -25% and -22.5%.
d.
To determine about what percent of all months had returns less than 0 for the U.S. stock market over a 273-month period.
d.
Answer to Problem 71E
Approximately, 37.36% of the months has returns less than 0.
Explanation of Solution
The figure below shows a histogram of the distribution of monthly returns for the U.S. stock market over a 273-month period:

Let us first estimate the frequency of corresponding to the interval of each bar, which is given by the height of the bars.
| Interval | Frequency |
| -25 < -22.5 | 2 |
| -22.5 < -20 | 0 |
| -20 < -17.5 | 0 |
| -17.5 < -15 | 1 |
| -15 < -12.5 | 0 |
| -12.5 < -10 | 4 |
| -10 < -7.5 | 6 |
| -7.5 < -5 | 11 |
| -5 < -2.5 | 28 |
| -2.5 < 0 | 50 |
| 0 < 2.5 | 78 |
| 2.5 < 5 | 58 |
| 5 < 7.5 | 24 |
| 7.5 < 10 | 8 |
| 10 < 12.5 | 3 |
Let us next add the frequencies of all intervals with negative returns.

Thus we then note that 102 of the 273 months in the sample have a return less than 0.
This then implies that approximately 37.36% of the months has returns less than 0.
Chapter 1 Solutions
PRACTICE OF STATISTICS F/AP EXAM
Additional Math Textbook Solutions
Essentials of Statistics (6th Edition)
Elementary Statistics: Picturing the World (6th Edition)
Introductory Statistics (2nd Edition)
Introductory Statistics (10th Edition)
Elementary Statistics (13th Edition)
Intro Stats, Books a la Carte Edition (5th Edition)


 MATLAB: An Introduction with ApplicationsStatisticsISBN:9781119256830Author:Amos GilatPublisher:John Wiley & Sons Inc
 Probability and Statistics for Engineering and th...StatisticsISBN:9781305251809Author:Jay L. DevorePublisher:Cengage Learning
 Statistics for The Behavioral Sciences (MindTap C...StatisticsISBN:9781305504912Author:Frederick J Gravetter, Larry B. WallnauPublisher:Cengage Learning
 Elementary Statistics: Picturing the World (7th E...StatisticsISBN:9780134683416Author:Ron Larson, Betsy FarberPublisher:PEARSON
 The Basic Practice of StatisticsStatisticsISBN:9781319042578Author:David S. Moore, William I. Notz, Michael A. FlignerPublisher:W. H. Freeman
 Introduction to the Practice of StatisticsStatisticsISBN:9781319013387Author:David S. Moore, George P. McCabe, Bruce A. CraigPublisher:W. H. Freeman