
Concept explainers
Videos
(a)
To find: the distribution has a clear left-skewed shape.
(a)
Answer to Problem 120E
Monday, Wednesday and Sunday
Explanation of Solution
Given:

The distribution has a skewed to the left shape, if the box of the box plot lies closest to the top between the whiskers of the box plot and if the horizontal line (median) in the box of the box plot lies near the top of the box.
It is observed that the distribution of Monday, Wednesday and Saturday have the left- skewed shape, because the box of the box plot is lying near the top between the whiskers of the box plot.
(b)
To find: the outlier stands out the most.
(b)
Answer to Problem 120E
Outlier of the Friday distribution, the reason is that the outlier lies furthest from the box plot of the distribution
Explanation of Solution
Given:

The outliers are showed by little circles in the box plots.
It is observed that there are four distributions with outliers: Tuesday, Thursday, Friday and Sunday.
The outlier that stands out the most is the outlier that lies furthest from the box plot and therefore the outlier of Friday stands out the most, as it is furthest from the box plot.
(c)
To find: the typical amount of sleep that the students got compare on these 7 nights.
(c)
Answer to Problem 120E
The highest typical amount of sleep occurs on Friday, while the lowest typical amount of sleep occurs on Thursday and the typical amount of sleep tends to decrease day by day from Friday to Thursday.
Explanation of Solution
Given:
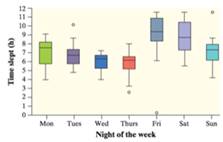
The typical amount of sleep that the students get are showed by the horizontal lines in the box of the box plot and it is observed that the highest typical amount of sleep occurs on where the lowest typical amount of sleep occurs on Thursday and the typical amount of sleep tends to decrease day by day from Friday to Thursday
(d)
To find: the night was the most variation in the students slept.
(d)
Answer to Problem 120E
Saturday night.
Explanation of Solution
Given:

The variation in the distribution is showed by the width between the whiskers of the box plot.
It is observe that the width between the whiskers of the whiskers of the box plot is higher for Saturday, which means that the most variation in the amount of sleep occurs on Saturday night.
Chapter 1 Solutions
PRACTICE OF STATISTICS F/AP EXAM
Additional Math Textbook Solutions
Elementary Statistics (13th Edition)
Introductory Statistics (10th Edition)
Intro Stats, Books a la Carte Edition (5th Edition)
Essentials of Statistics, Books a la Carte Edition (5th Edition)


 MATLAB: An Introduction with ApplicationsStatisticsISBN:9781119256830Author:Amos GilatPublisher:John Wiley & Sons Inc
 Probability and Statistics for Engineering and th...StatisticsISBN:9781305251809Author:Jay L. DevorePublisher:Cengage Learning
 Statistics for The Behavioral Sciences (MindTap C...StatisticsISBN:9781305504912Author:Frederick J Gravetter, Larry B. WallnauPublisher:Cengage Learning
 Elementary Statistics: Picturing the World (7th E...StatisticsISBN:9780134683416Author:Ron Larson, Betsy FarberPublisher:PEARSON
 The Basic Practice of StatisticsStatisticsISBN:9781319042578Author:David S. Moore, William I. Notz, Michael A. FlignerPublisher:W. H. Freeman
 Introduction to the Practice of StatisticsStatisticsISBN:9781319013387Author:David S. Moore, George P. McCabe, Bruce A. CraigPublisher:W. H. Freeman