
Concept explainers
Videos
a)
The overall shape of the distribution of calories per serving for 77 brands of cereal breakfast.
Given:The histogram of calories per serving for 77 brands of cereal breakfast as shown below
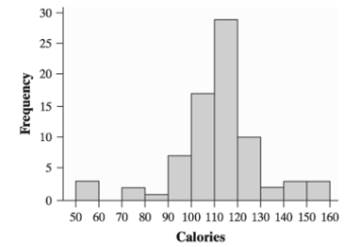
Explanation:The histogram looks approximately symmetrical. The overall shape of the distribution of calories per serving for 77 brands of cereal breakfast is approximately symmetrical.
b)
The approximate center of the distribution.
The approximate center of the distribution lies between 110 and 120 calories per serving.
Explanation:The total brands of cereal breakfast = n =77
The median will be the midpoint which will be 39th brand once the calories per serving are arranged in ascending order.
So approximately the 39th term fall in interval 110 calories per serving to 120 calories per serving as shown below.
Conclusion: The center of the distribution will be approximately between 110 and 120 calories per serving.
c)
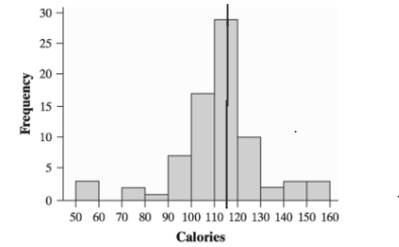
The maximum number of calories per serving of these 77 brands of cereal breakfast.
The maximum number of calories per serving of these 77 brands of cereal breakfast lies between 150 and 160 calories per serving.
Explanation:
with reference to histogram the maximum number of calories per serving will be between 150 and 160 calories per serving as shown below
Here in histogram as the horizontal axis will have class intervals and the height of bar will be its frequency, the class interval which is to extreme right will have the maximum calories per serve can be determined. So the exact value of maximum calories per serve cannot be determined. The maximum calories per serve will be between 150 and 160 calories.
d)
The percentage of cereal brands with 130 or more calories per serving.
There are 10.39% of cereal brands serve 130 or more calories per serving.
Explanation:With reference to histogram
The number of brands which serve 130 or more calories per serve = 8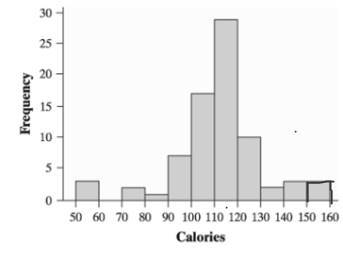
The total number of cereal brands = 77
The percentage of cereal brands which serve 130 calories or more per serve are
Hence there are 10.39% of cereal brands which serve 130 or more calories per serve.
Chapter 1 Solutions
PRACTICE OF STATISTICS F/AP EXAM
Additional Math Textbook Solutions
Introductory Statistics
Introductory Statistics (10th Edition)
Basic Business Statistics, Student Value Edition
Introductory Statistics (2nd Edition)
Essentials of Statistics, Books a la Carte Edition (5th Edition)
Intro Stats, Books a la Carte Edition (5th Edition)


 MATLAB: An Introduction with ApplicationsStatisticsISBN:9781119256830Author:Amos GilatPublisher:John Wiley & Sons Inc
 Probability and Statistics for Engineering and th...StatisticsISBN:9781305251809Author:Jay L. DevorePublisher:Cengage Learning
 Statistics for The Behavioral Sciences (MindTap C...StatisticsISBN:9781305504912Author:Frederick J Gravetter, Larry B. WallnauPublisher:Cengage Learning
 Elementary Statistics: Picturing the World (7th E...StatisticsISBN:9780134683416Author:Ron Larson, Betsy FarberPublisher:PEARSON
 The Basic Practice of StatisticsStatisticsISBN:9781319042578Author:David S. Moore, William I. Notz, Michael A. FlignerPublisher:W. H. Freeman
 Introduction to the Practice of StatisticsStatisticsISBN:9781319013387Author:David S. Moore, George P. McCabe, Bruce A. CraigPublisher:W. H. Freeman