
Videos
a.
To know that do students who graduate from high school earn more money than students who do not and will it be appropriate to use frequency histograms instead of relative frequency histograms in this setting.
a.
Answer to Problem 75E
No. it would not be appropriate to use frequency histograms instead of relative frequency histograms.
Explanation of Solution
Given a random sample of 371 U.S. residents aged 18 and older. The educational level and total personal income of each person were recorded. The data for the 57 non-graduates (No) and the 314 graduates (Yes) are displayed in the relative frequency histograms provided below:
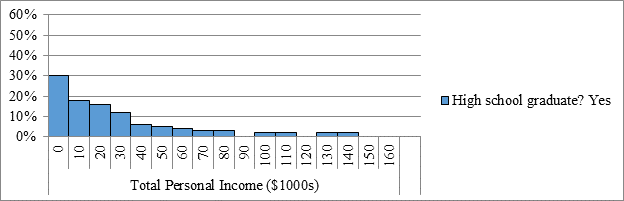
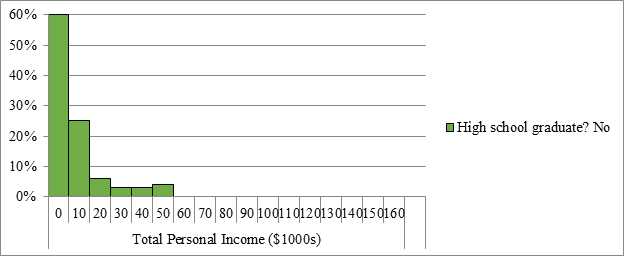
It would not be appropriate to use frequency histograms instead of relative frequency histograms, because the two histograms do not use the same number of data values (as there are 314 graduates but only 57 non-graduates). Since these two histograms would then not be based on the same number of data values, we would not be able to compare the frequency histograms.
b.
To know that do students who graduate from high school earn more money than students who do not and to compare the distributions of total personal income for these two groups.
b.
Answer to Problem 75E
Both distributions are skewed to the right.
The distribution of the nongraduates do not appear to contain any outliers, while the distribution of the graduates contains possible outliers.
The center of both distributions appears to be roughly between 0 and 10 thousand dollars.
The spread of the graduate distributions is greater than the spread for the nongraduate distribution.
Explanation of Solution
Given a random sample of 371 U.S. residents aged 18 and older. The educational level and total personal income of each person were recorded. The data for the 57 non-graduates (No) and the 314 graduates (Yes) are displayed in the relative frequency histograms provided below:
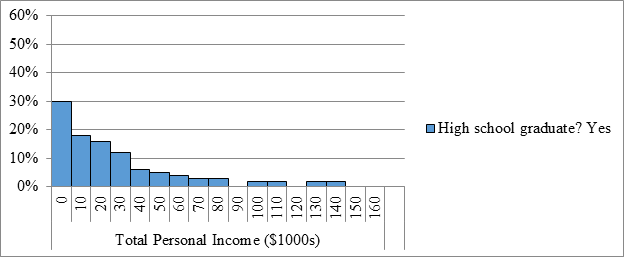
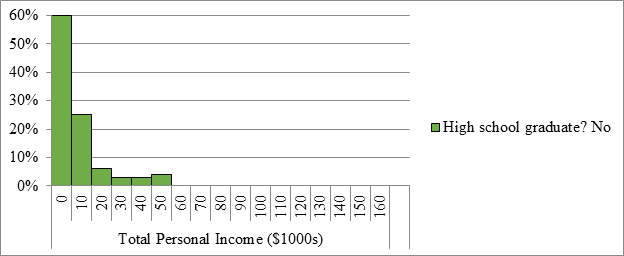
Both distributions are skewed to the right, because the highest bars are to the left in the histograms with a tail of smaller bars to the right as shown in the histograms above.
The distribution of the nongraduates do not appear to contain any outliers, because there are no gaps in the histogram. The distribution of the graduates contains possible outliers, because there are 4 bars in the histogram that are separated from the rest of the bars in the histogram with a gap.
The center of both distributions appears to be roughly between 0 and 10 thousand dollars, as we expect the center to be roughly at the highest bar in the histogram.The spread of the graduate distributions is greater than the spread for the nongraduate distribution, because the histogram for the graduates is wider compared to the histogram of the nongraduates.
Chapter 1 Solutions
PRACTICE OF STATISTICS F/AP EXAM
Additional Math Textbook Solutions
An Introduction to Mathematical Statistics and Its Applications (6th Edition)
Introductory Statistics (2nd Edition)
Essentials of Statistics, Books a la Carte Edition (5th Edition)
STATS:DATA+MODELS-W/DVD
Statistical Reasoning for Everyday Life (5th Edition)
Basic Business Statistics, Student Value Edition (13th Edition)


 MATLAB: An Introduction with ApplicationsStatisticsISBN:9781119256830Author:Amos GilatPublisher:John Wiley & Sons Inc
 Probability and Statistics for Engineering and th...StatisticsISBN:9781305251809Author:Jay L. DevorePublisher:Cengage Learning
 Statistics for The Behavioral Sciences (MindTap C...StatisticsISBN:9781305504912Author:Frederick J Gravetter, Larry B. WallnauPublisher:Cengage Learning
 Elementary Statistics: Picturing the World (7th E...StatisticsISBN:9780134683416Author:Ron Larson, Betsy FarberPublisher:PEARSON
 The Basic Practice of StatisticsStatisticsISBN:9781319042578Author:David S. Moore, William I. Notz, Michael A. FlignerPublisher:W. H. Freeman
 Introduction to the Practice of StatisticsStatisticsISBN:9781319013387Author:David S. Moore, George P. McCabe, Bruce A. CraigPublisher:W. H. Freeman