
Concept explainers
Videos
(a)
To find: the shape of the distribution of income has.
(a)
Answer to Problem 119E
Right skewed
Explanation of Solution
Given:

By seeing the figure, it is observe that all five of the distributions of income are right skewed, because the box of the box plots are lying near the bottom between the two whiskers (which associates with small values) and the lines in the box of the box plots lie closest to the bottom of the box.
(b)
To Explain: that there are outliers in the group that earned an advanced degree.
(b)
Answer to Problem 119E
The upper whisker of the box plot “Advanced” is more than one and half times the width of the box in the box plot.
Explanation of Solution
Given:

Outliers are observations that are more than one and half times the IQR above
The third
It is observed that the upper whisker of the box plot “Advanced” is more than 1.5 times the width of the box in the box plot and therefore the data set “Advanced” requires to contain at least one outlier (as it will contain a data value that is more than one and half IQR above
(c)
To Explain: that the typical income change as the highest education level reached increases.
(c)
Answer to Problem 119E
The income looks to increase as the highest education level increases
Explanation of Solution
Given:

It is observed that the income appears as the highest education level increases; the reason is that the box plot lies higher if the education level is higher. This also makes sense, the reason is that the higher your degree, the more money you tend to make.
(d)
To Explain: the variability in income changes as the highest education level reached increases.
(d)
Answer to Problem 119E
Variability increases
Explanation of Solution
Given:
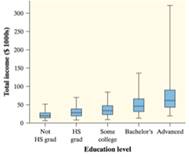
The variability of the income at an education level is showed by the width between the whiskers of the box plot. It is observed that the width between the whiskers increases as the highest education level increases, which means that the variability increases as the highest education level increases.
Chapter 1 Solutions
PRACTICE OF STATISTICS F/AP EXAM
Additional Math Textbook Solutions
Elementary Statistics
Elementary Statistics: Picturing the World (6th Edition)
Basic Business Statistics, Student Value Edition
Fundamentals of Statistics (5th Edition)


 MATLAB: An Introduction with ApplicationsStatisticsISBN:9781119256830Author:Amos GilatPublisher:John Wiley & Sons Inc
 Probability and Statistics for Engineering and th...StatisticsISBN:9781305251809Author:Jay L. DevorePublisher:Cengage Learning
 Statistics for The Behavioral Sciences (MindTap C...StatisticsISBN:9781305504912Author:Frederick J Gravetter, Larry B. WallnauPublisher:Cengage Learning
 Elementary Statistics: Picturing the World (7th E...StatisticsISBN:9780134683416Author:Ron Larson, Betsy FarberPublisher:PEARSON
 The Basic Practice of StatisticsStatisticsISBN:9781319042578Author:David S. Moore, William I. Notz, Michael A. FlignerPublisher:W. H. Freeman
 Introduction to the Practice of StatisticsStatisticsISBN:9781319013387Author:David S. Moore, George P. McCabe, Bruce A. CraigPublisher:W. H. Freeman