
Videos
(a)
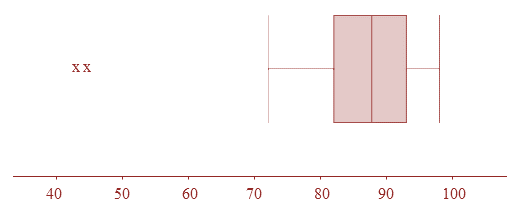
Create a boxplot of the data shown.
(a)
Answer to Problem 112E
The box starts at 1st
Explanation of Solution
Given information:
Scores of Mrs. Liao’s students on their first statistics test:
93 93 87.5 91 94.5 72 96 95 93.5 93.5 73
82 45 88 80 86 85.5 87.5 81 78 86 89
92 91 98 85 82.5 88 94.5 43
Arrange the data values in ascending order:
43, 45, 72, 73, 78, 80, 81, 82, 82.5, 85, 85.5, 86, 87.5, 88, 88, 89, 91, 91, 92, 93, 93, 93.5, 94.5, 94.5, 95, 96, 98
We have
The number of data values is even.
The median of the sorted data set is the average of two middle values (87.5 and 88).
Now,
The 1st quartile is the median of all data values below the median (calculated above).
However,
The data set contains 15 values below the median (calculated above).
Then
The 1st quartile will be the 8th data value.
Thus,
Now,
The 3rd quartile is the median of all data values above the median (calculated above).
However,
The data set contains 15 values above the median (calculated above).
Then
The 3rd quartile will be the 22th data value.
Thus,
The observation more than 1.5 times the IQR above Q3 or below Q1 .
The difference between 3rd and 1st quartile gives the
Then
And
From the data values, the minimum is 43 and the maximum is 98.
Then
Note that
43 and 45 are outliers.
For boxplot:
The box has thequartiles, boundaries and a vertical line have been drawn at the median.
The whiskers represent the minimum and maximum of the data points which are not outliers.
X represents the outliers.
(b)
Discuss the performance of the students on Mrs. Liao’s first statistics test.
(b)
Answer to Problem 112E
Students performed well on Mrs. Liao’s first statistics test.
Explanation of Solution
Given information:
Scores of Mrs. Liao’s students on their first statistics test:
93 93 87.5 91 94.5 72 96 95 93.5 93.5 73
82 45 88 80 86 85.5 87.5 81 78 86 89
92 91 98 85 82.5 88 94.5 43
Arrange the data values in ascending order:
43, 45, 72, 73, 78, 80, 81, 82, 82.5, 85, 85.5, 86, 87.5, 88, 88, 89, 91, 91, 92, 93, 93, 93.5, 94.5, 94.5, 95, 96, 98
We have
The number of data values is even.
The median of the sorted data set is the average of two middle values (87.5 and 88).
Now,
The 1st quartile is the median of all data values below the median (calculated above).
However,
The data set contains 15 values below the median (calculated above).
Then
The 1st quartile will be the 8th data value.
Thus,
This implies
25% of the students have scored 82 or less.
Thus,
Remaining 75% of the students have scored more than 82.
This indicates
The students have performed very well on Mrs. Liao’s first test.
Chapter 1 Solutions
PRACTICE OF STATISTICS F/AP EXAM
Additional Math Textbook Solutions
Elementary Statistics
Essentials of Statistics, Books a la Carte Edition (5th Edition)
Fundamentals of Statistics (5th Edition)
Statistics for Business and Economics (13th Edition)
Essentials of Statistics (6th Edition)
Basic Business Statistics, Student Value Edition (13th Edition)


 MATLAB: An Introduction with ApplicationsStatisticsISBN:9781119256830Author:Amos GilatPublisher:John Wiley & Sons Inc
 Probability and Statistics for Engineering and th...StatisticsISBN:9781305251809Author:Jay L. DevorePublisher:Cengage Learning
 Statistics for The Behavioral Sciences (MindTap C...StatisticsISBN:9781305504912Author:Frederick J Gravetter, Larry B. WallnauPublisher:Cengage Learning
 Elementary Statistics: Picturing the World (7th E...StatisticsISBN:9780134683416Author:Ron Larson, Betsy FarberPublisher:PEARSON
 The Basic Practice of StatisticsStatisticsISBN:9781319042578Author:David S. Moore, William I. Notz, Michael A. FlignerPublisher:W. H. Freeman
 Introduction to the Practice of StatisticsStatisticsISBN:9781319013387Author:David S. Moore, George P. McCabe, Bruce A. CraigPublisher:W. H. Freeman