
Concept explainers
Videos
Stock Beta. In June of 2016, Yahoo Finance reported the beta value for Coca-Cola was .82 (Yahoo Finance website). Betas for individual stocks are determined by simple linear regression. The dependent variable is the total return for the stock, and the independent variable is the total return for the stock market, such as the return of the S&P 500. The slope of this regression equation is referred to as the stock’s beta. Many financial analysts prefer to measure the risk of a stock by computing the stock’s beta value.
The data contained in the DATAfile named CocaCola show the monthly percentage returns for the S&P 500 and the Coca-Cola Company for August 2015 to May 2016.
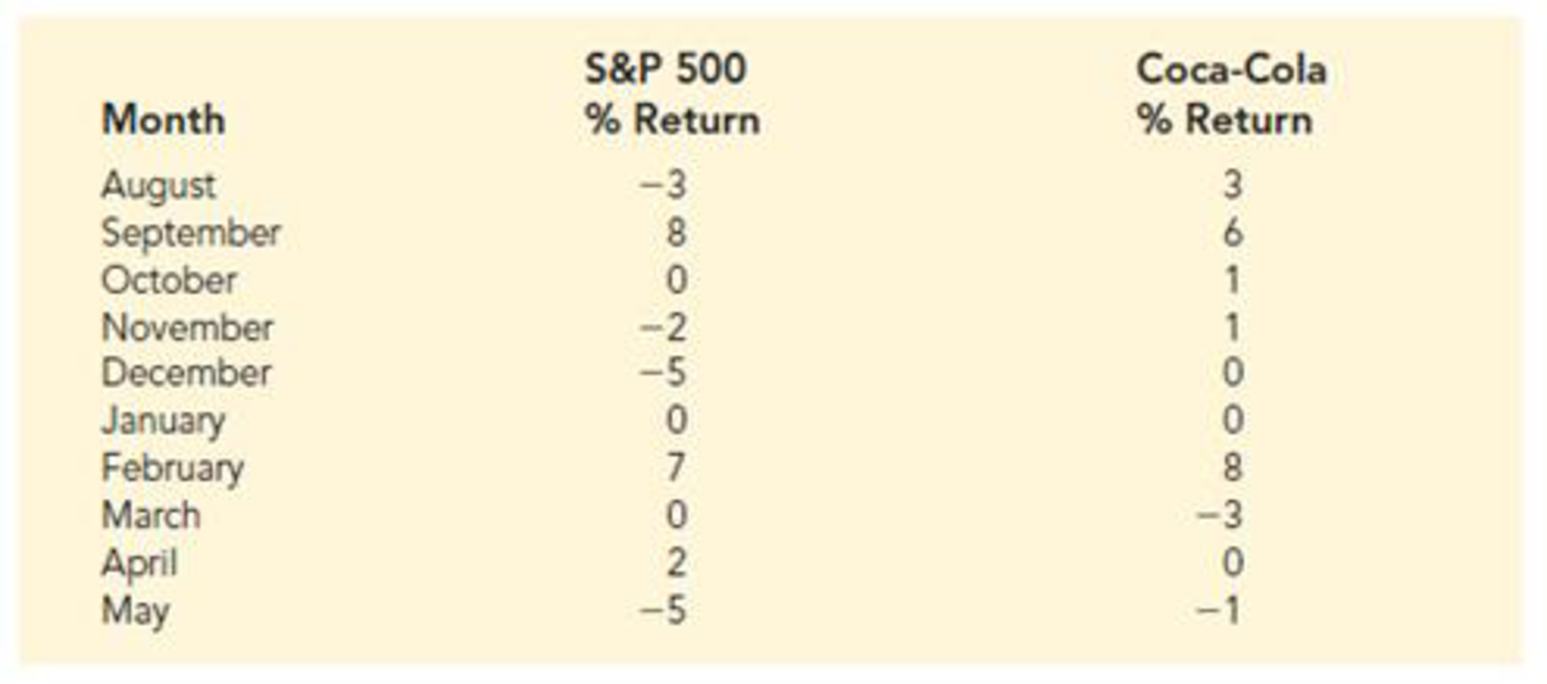
- a. Develop a
scatter diagram with the S&P % Return as the independent variable. - b. What does the scatter diagram developed in part (a) indicate about the relationship between the returns of the S&P 500 and those of the Coca-Cola Company?
- c. Develop the least squares estimated regression equation.
- d. Provide an interpretation for the slope of the estimated equation (that is, the beta).
- e. Is your beta estimate close to .82? If not, why might your estimate be different?
Want to see the full answer?
Check out a sample textbook solution
Chapter 14 Solutions
Modern Business Statistics with Microsoft Office Excel (with XLSTAT Education Edition Printed Access Card) (MindTap Course List)


- Life Expectancy The following table shows the average life expectancy, in years, of a child born in the given year42 Life expectancy 2005 77.6 2007 78.1 2009 78.5 2011 78.7 2013 78.8 a. Find the equation of the regression line, and explain the meaning of its slope. b. Plot the data points and the regression line. c. Explain in practical terms the meaning of the slope of the regression line. d. Based on the trend of the regression line, what do you predict as the life expectancy of a child born in 2019? e. Based on the trend of the regression line, what do you predict as the life expectancy of a child born in 1580?2300arrow_forwardFind the equation of the regression line for the following data set. x 1 2 3 y 0 3 4arrow_forward
 Algebra and Trigonometry (MindTap Course List)AlgebraISBN:9781305071742Author:James Stewart, Lothar Redlin, Saleem WatsonPublisher:Cengage Learning
 Functions and Change: A Modeling Approach to Coll...AlgebraISBN:9781337111348Author:Bruce Crauder, Benny Evans, Alan NoellPublisher:Cengage Learning
 Glencoe Algebra 1, Student Edition, 9780079039897...AlgebraISBN:9780079039897Author:CarterPublisher:McGraw Hill