
Modern Business Statistics with Microsoft Office Excel (with XLSTAT Education Edition Printed Access Card) (MindTap Course List)
6th Edition
ISBN: 9781337115186
Author: David R. Anderson, Dennis J. Sweeney, Thomas A. Williams, Jeffrey D. Camm, James J. Cochran
Publisher: Cengage Learning
expand_more
expand_more
format_list_bulleted
Concept explainers
Videos
Textbook Question
Chapter 14.2, Problem 9E
Companies in the U.S. car rental market vary greatly in terms of the size of the fleet, the number of locations, and annual revenue. In 2011 Hertz had 320,000 cars in service and annual revenue of approximately $4.2 billion. The following data show the number of cars in service (1000s) and the annual revenue ($millions) for six smaller car rental companies (Auto Rental News website, August 7, 2012).
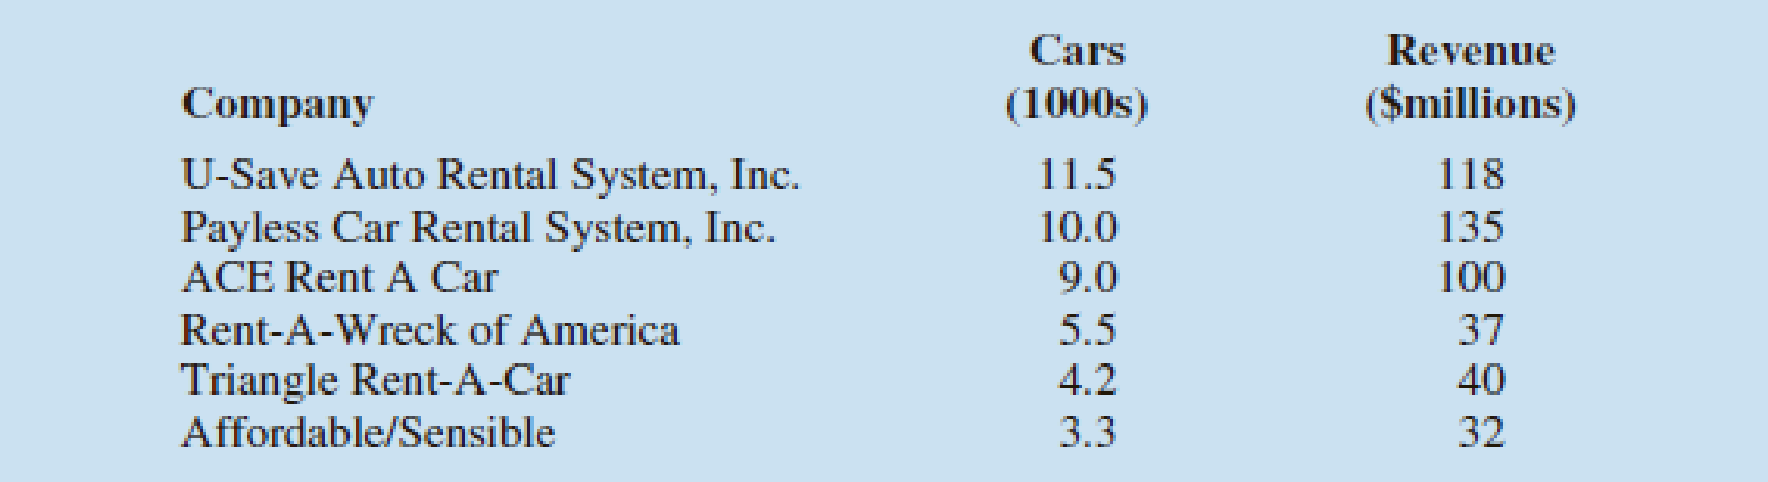
- a. Develop a
scatter diagram with the number of cars in service as the independent variable. - b. What does the scatter diagram developed in part (a) indicate about the relationship between the two variables?
- c. Use the least squares method to develop the estimated regression equation.
- d. For every additional car placed in service, estimate how much annual revenue will change.
- e. Fox Rent A Car has 11,000 cars in service. Use the estimated regression equation developed in part (c) to predict annual revenue for Fox Rent A Car.
Expert Solution & Answer

Trending nowThis is a popular solution!

Students have asked these similar questions
Companies in the U.S. car rental market vary greatly in terms of the size of the fleet, the number of locations, and annual revenue. In 2011, Hertz had 320,000 cars in service and annual revenue of approximately $4.2 billion. Suppose the following data show the number of cars in service (1,000s) and the annual revenue ($ millions) for six smaller car rental companies.
Company
Cars(1,000s)
Revenue($ millions)
Company A
11.5
118
Company B
10.0
137
Company C
9.0
102
Company D
5.5
39
Company E
4.2
40
Company F
3.3
32
(a)
Develop a scatter diagram with the number of cars in service as the independent variable.
A scatter diagram has 6 points plotted on it. The horizontal axis ranges from 0 to 14 and is labeled: Cars in Service (1,000s). The vertical axis ranges from 0 to 160 and is labeled: Annual Revenue ($ millions). The points are plotted from left to right in an upward, diagonal direction starting from the lower left corner of the diagram and are between 3 to 12 on…
Companies in the U.S. car rental market vary greatly in terms of the size of the fleet, the number of locations, and annual revenue. In 2011, Hertz had 320,000 cars in service and annual revenue of approximately $4.2 billion. Suppose the following data show the number of cars in service (1,000s) and the annual revenue ($ millions) for six smaller car rental companies.
Company
Cars(1,000s)
Revenue($ millions)
Company A
11.5
118
Company B
10.0
133
Company C
9.0
98
Company D
5.5
37
Company E
4.2
40
Company F
3.3
30
(a)
Develop a scatter diagram with the number of cars in service as the independent variable.
A scatter diagram has 6 points plotted on it. The horizontal axis ranges from 0 to 14 and is labeled: Cars in Service (1,000s). The vertical axis ranges from 0 to 160 and is labeled: Annual Revenue ($ millions). The points are plotted from left to right in an upward, diagonal direction starting from the lower left corner of the diagram and are between 3 to 12 on…
Companies in the U.S. car rental market vary greatly in terms of the size of the fleet, the number of locations, and annual revenue. In 2011, Hertz had 320,000 cars in service and annual revenue of approximately $4.2 billion. Suppose the following data show the number of cars in service (1,000s) and the annual revenue ($ millions) for six smaller car rental companies.
Company
Cars(1,000s)
Revenue($ millions)
Company A
11.5
116
Company B
10.0
133
Company C
9.0
98
Company D
5.5
37
Company E
4.2
40
Company F
3.3
32
a.Use the least squares method to develop the estimated regression equation that can be used to predict annual revenue (in $ millions) given the number of cars in service (in 1,000s). (Round your numerical values to three decimal places.)
b.
For every additional car placed in service, estimate how much annual revenue will change (in dollars). (Round your answer to the nearest integer.)
Annual revenue will increase by $ , for every additional car placed in…
Chapter 14 Solutions
Modern Business Statistics with Microsoft Office Excel (with XLSTAT Education Edition Printed Access Card) (MindTap Course List)
Ch. 14.2 - Given are five observations for two variables, x...Ch. 14.2 - Given are five observations for two variables, x...Ch. 14.2 - Given are five observations collected in a...Ch. 14.2 - Retail and Trade: Female Managers. The following...Ch. 14.2 - Production Line Speed and Quality Control. Brawdy...Ch. 14.2 - The National Football League (NFL) records a...Ch. 14.2 - Sales Experience and Performance. A sales manager...Ch. 14.2 - Broker Satisfaction. The American Association of...Ch. 14.2 - Companies in the U.S. car rental market vary...Ch. 14.2 - Age and the Price of Wine. For a particular red...
Ch. 14.2 - Laptop Ratings. To help consumers in purchasing a...Ch. 14.2 - Stock Beta. In June of 2016, Yahoo Finance...Ch. 14.2 - Distance and Absenteeism. A large city hospital...Ch. 14.2 - Using a global-positioning-system (GPS)-based...Ch. 14.3 - 15. The data from exercise 1...Ch. 14.3 - The data from exercise 2 follow.
The estimated...Ch. 14.3 - Prob. 17ECh. 14.3 - Price and Quality of Headphones. The following...Ch. 14.3 - Sales Experience and Sales Performance. In...Ch. 14.3 - Price and Weight of Bicycles. Bicycling, the...Ch. 14.3 - Cost Estimation. An important application of...Ch. 14.3 - 22. Refer to exercise 9, where the following data...Ch. 14.5 - The data from exercise 1 follow.
Compute the mean...Ch. 14.5 - The data from exercise 2 follow.
Compute the mean...Ch. 14.5 - The data from exercise 3 follow.
What is the...Ch. 14.5 - Prob. 26ECh. 14.5 - To identify high-paying jobs for people who do not...Ch. 14.5 - Broker Satisfaction Conclusion. In exercise 8,...Ch. 14.5 - Cost Estimation Conclusion. Refer to exercise 21,...Ch. 14.5 - Significance of Fleet Size on Rental Car Revenue....Ch. 14.5 - Significance of Racing Bike Weight on Price. In...Ch. 14.6 - 32. The data from exercise 1...Ch. 14.6 - 33. The data from exercise 2...Ch. 14.6 - Prob. 34ECh. 14.6 - 35. The following data are the monthly salaries y...Ch. 14.6 - 36. In exercise 7, the data on y = annual sales ($...Ch. 14.6 - In exercise 5, the following data on x = the...Ch. 14.6 - Prob. 38ECh. 14.6 - 39. In exercise 12, the following data on x =...Ch. 14.7 - The commercial division of a real estate firm...Ch. 14.7 - Following is a portion of the regression output...Ch. 14.7 - Prob. 43ECh. 14.7 - Auto Racing Helmet. Automobile racing,...Ch. 14.8 - Prob. 45ECh. 14.8 - Prob. 46ECh. 14.8 - Prob. 47ECh. 14.8 - Prob. 48ECh. 14.8 - Prob. 49ECh. 14.9 - Consider the following data for two variables, x...Ch. 14.9 - Prob. 51ECh. 14.9 - Predicting Charity Expenses. Charity Navigator is...Ch. 14.9 - Many countries, especially those in Europe, have...Ch. 14.9 - Valuation of a Major League Baseball Team. The...Ch. 14 - The Dow Jones Industrial Average (DJIA) and the...Ch. 14 - Home Sire and Price. Is the number of square feet...Ch. 14 - Online Education. One of the biggest changes in...Ch. 14 - Machine Maintenance. Jensen Tire & Auto is in the...Ch. 14 - Bus Maintenance. The regional transit authority...Ch. 14 - Studying and Grades. A marketing professor at...Ch. 14 - Used Car Mileage and Price. The Toyota Camry is...Ch. 14 - One measure of the risk or volatility of an...Ch. 14 - As part of a study on transportation safety, the...Ch. 14 - Consumer Reports tested 166 different...Ch. 14 - When trying to decide what car to buy, real value...Ch. 14 - Buckeye Creek Amusement Park is open from the...
Knowledge Booster


Learn more about
Need a deep-dive on the concept behind this application? Look no further. Learn more about this topic, statistics and related others by exploring similar questions and additional content below.Similar questions
- Companies in the U.S. car rental market vary greatly in terms of the size of the fleet, the number of locations, and annual revenue. In 2011, Hertz had 320,000 cars in service and annual revenue of approximately $4.2 billion. Suppose the following data show the number of cars in service (1,000s) and the annual revenue ($ millions) for six smaller car rental companies. Company Cars (1,000s) Revenue ($ millions) Company A 11.5 116 Company B 10 137 Company C 9 102 Company D 5.5 39 Company E 4.2 38 Company F 3.3 30 (a) Develop a scatter diagram with the number of cars in service as the independent variable. (b) What does the scatter diagram developed in part (a) indicate about the relationship between the two variables? (c) Use the least squares method to develop the estimated regression equation that can be used to predict annual revenue (in $ millions) given the number of cars in service (in 1,000s). (Round your numerical values to three decimal…arrow_forwardA commercial vegetable and fruit grower carefully observes the relationship between the amount of fertilizer used on a certain variety of pumpkin and the revenue made from sales of the resulting pumpkin crop, recorded in the following table Amount of Fertilizer (pounds/acre) 250 500 750 1000 1250 1500 1750 2000 Revenue earned (dollars/acre) 96 145 172 185 192 196 198 199 The fertilizer costs $0.14 per pound. What would you advise the grower is the most profitable amount of fertilizer to use? Check your advice by answering/calculating the following. Is each pound of fertilizer equally effective? Explain. Graph the data and then estimate the maximum amount of revenue that can be earned per acre from your graph. Call this estimate k. Compute a linear regression for the data. Compute a logarithmic regression(LnReg) for the data. Use trial and error on your calculator to fit a function of the form r=k(1−bx)r=k(1-bx) where k is the estimate for the maximum amount of revenue and…arrow_forwardA web page design firm has two designs for an online hardware store. To determine which is the more effective design, the firm uses one page withwith onlyonly malemale visitorsvisitors andand aa secondsecond pagepage withwith onlyonly femalefemale visitors.visitors. For each visit, the firm records thethe amountamount of timeof time visitingvisiting the sitethe site and thethe numbernumber ofof itemsitems viewedviewed. Complete parts (a) through (c) below.(a) What is the explanatory variable in this study? Is it qualitative or quantitative? A.The explanatory variable is thethe amountamount of timeof time visitingvisiting the sitethe site. This explanatory variable is quantitativequantitative. B.The explanatory variable is the web page design. The explanatory variable is qualitative. C.The explanatory variable is the gendergender. This explanatory variable is qualitative. D.The explanatory variable is thethe numbernumber ofof itemsitems viewedviewed. This explanatory variable is…arrow_forward
- The following table provides data on three popular protein supplements. (Figures shown correspond to a single serving.) Protein (g) Carbohydrates (g) Sodium (mg) Cost ($) DesignerWhey (Next) 18 2 80 0.50 Muscle Milk(Cytosport) 32 16 240 1.60 Pure WheyProtein Stack(Champion) 24 3 100 0.60 You are thinking of combining Designer Whey and Muscle Milk to obtain a 7-day supply that provides exactly 376 grams of protein and 104 grams of carbohydrates. How many servings of each supplement should you combine in order to meet your requirements? Designer Whey servings= Muscle Milk servings= What will it cost? $arrow_forwardompanies in the U.S. car rental market vary greatly in terms of the size of the fleet, the number of locations, and annual revenue. In 2011, Hertz had 320,000 cars in service and annual revenue of approximately $4.2 billion. Suppose the following data show the number of cars in service (1,000s) and the annual revenue ($ millions) for six smaller car rental companies. Company Cars(1,000s) Revenue($ millions) Company A 11.5 120 Company B 10.0 133 Company C 9.0 98 Company D 5.5 37 Company E 4.2 38 Company F 3.3 30 (a) Develop a scatter diagram with the number of cars in service as the independent variable. A scatter diagram has 6 points plotted on it. The horizontal axis ranges from 0 to 14 and is labeled: Cars in Service (1,000s). The vertical axis ranges from 0 to 160 and is labeled: Annual Revenue ($ millions). The points are plotted from left to right in an upward, diagonal direction starting from the lower left corner of the diagram and are between 3 to 12 on…arrow_forwardThe following table provides data on three popular protein supplements. (Figures shown correspond to a single serving.) Protein(g) Carbohydrates(g) Sodium(mg) Cost($) DesignerWhey (Next) 18 2 80 0.50 Muscle Milk(Cytosport) 32 16 240 1.60 Pure WheyProtein Stack(Champion) 24 3 100 0.60 You are thinking of combining Designer Whey and Muscle Milk to obtain a 7-day supply that provides exactly 448 grams of protein and 112 grams of carbohydrates. How many servings of each supplement should you combine in order to meet your requirements? Designer Whey ______ servingsMuscle Milk ______ servings What will it cost? $arrow_forward
- The following table provides data on three popular protein supplements. (Figures shown correspond to a single serving.) Protein (g) Carbohydrates (g) Sodium (mg) Cost ($) Designer Whey (Next) 18 2 80 0.50 Muscle Milk (Cytosport) 32 16 240 1.60 Pure Whey Protein Stack (Champion) 24 3 100 0.60 You have a mixture of Designer Whey and Muscle Milk that costs a total of $16 and supplies exactly 112 grams of carbohydrates. How many grams of protein does it supply?arrow_forwardThe following table provides data on three popular protein supplements. (Figures shown correspond to a single serving.) Protein(g) Carbohydrates(g) Sodium(mg) Cost($) DesignerWhey (Next) 18 2 80 0.50 Muscle Milk(Cytosport) 32 16 240 1.60 Pure WheyProtein Stack(Champion) 24 3 100 0.60 You have a mixture of Designer Whey and Muscle Milk that costs a total of $14 and supplies exactly 107 grams of carbohydrates. How many grams of protein does it supply?arrow_forwardFull time year around median salary for u.s men in 2010 was 41,300 and the full time year round salary for u.s women in 2010 was 34,000 The full time year round median salary for u.s men in 2010 was ___% of the full time year round median salary for u.s women in 2010arrow_forward
- The following table provides data on three popular protein supplements. (Figures shown correspond to a single serving.) Protein (g) Carbohydrates (g) Sodium (mg) Cost ($) DesignerWhey (Next) 18 2 80 0.50 Muscle Milk(Cytosport) 32 16 240 1.60 Pure WheyProtein Stack(Champion) 24 3 100 0.60 You have a mixture of Designer Whey and Muscle Milk that costs a total of $17 and supplies exactly 110 grams of carbohydrates. How many grams of protein does it supply?arrow_forwardIn the packaging department of a large aircraft parts distributor, a fairly reliable estimate ofpackaging and processing costs can be determined by knowing the weight of an order. Thus, theweight is a cost driver that accounts for a sizable fraction of the packaging and processing costsat this company. Data for the past 10 orders are given as follows:arrow_forwardThe Sanders Garden Shop mixes two types of grass seed into a blend. Each type of grass has been rated (per pound) according to its shade tolerance, ability to stand up to traffic, and drought resistance, as shown in the table. Type A seed costs $1 and Type B seed costs $2. If the blend needs to score at least 300 points for shade tolerance, 400 points for traffic resistance, and 750 points for drought resistance, how many pounds of each seed should be in the blend? Which targets will be exceeded? How much will the blend cost? Type A Type B Shade Tolerance 1 1 Traffic Resistance 2 1 Drought Resistance 2 5arrow_forward
arrow_back_ios
SEE MORE QUESTIONS
arrow_forward_ios
Recommended textbooks for you
 Glencoe Algebra 1, Student Edition, 9780079039897...AlgebraISBN:9780079039897Author:CarterPublisher:McGraw Hill
 Algebra: Structure And Method, Book 1AlgebraISBN:9780395977224Author:Richard G. Brown, Mary P. Dolciani, Robert H. Sorgenfrey, William L. ColePublisher:McDougal Littell
Glencoe Algebra 1, Student Edition, 9780079039897...
Algebra
ISBN:9780079039897
Author:Carter
Publisher:McGraw Hill
Algebra: Structure And Method, Book 1
Algebra
ISBN:9780395977224
Author:Richard G. Brown, Mary P. Dolciani, Robert H. Sorgenfrey, William L. Cole
Publisher:McDougal Littell
Use of ALGEBRA in REAL LIFE; Author: Fast and Easy Maths !;https://www.youtube.com/watch?v=9_PbWFpvkDc;License: Standard YouTube License, CC-BY
Compound Interest Formula Explained, Investment, Monthly & Continuously, Word Problems, Algebra; Author: The Organic Chemistry Tutor;https://www.youtube.com/watch?v=P182Abv3fOk;License: Standard YouTube License, CC-BY
Applications of Algebra (Digit, Age, Work, Clock, Mixture and Rate Problems); Author: EngineerProf PH;https://www.youtube.com/watch?v=Y8aJ_wYCS2g;License: Standard YouTube License, CC-BY