
Modern Business Statistics with Microsoft Office Excel (with XLSTAT Education Edition Printed Access Card) (MindTap Course List)
6th Edition
ISBN: 9781337115186
Author: David R. Anderson, Dennis J. Sweeney, Thomas A. Williams, Jeffrey D. Camm, James J. Cochran
Publisher: Cengage Learning
expand_more
expand_more
format_list_bulleted
Concept explainers
Videos
Textbook Question
Chapter 14.6, Problem 37E
In exercise 5, the following data on x = the number of defective parts found and y = the line speed (feet per minute) for a production process at Brawdy Plastics provided the estimated regression equation
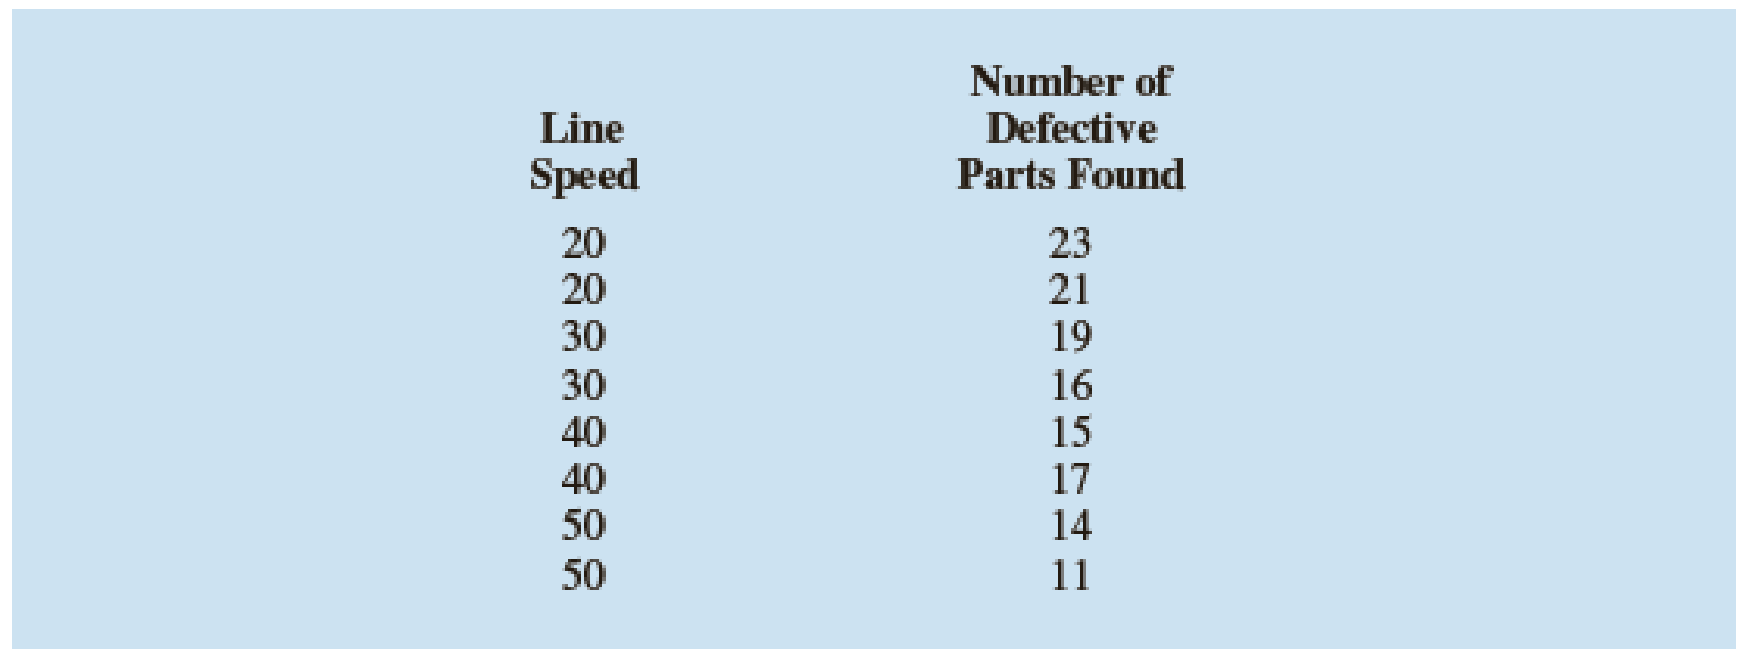
For these data SSE = 16. Develop a 95% confidence interval for the
Expert Solution & Answer
Want to see the full answer?
Check out a sample textbook solution
Students have asked these similar questions
So I generated this table with stat program, which is from a regression of temperature (in °C) on atmospheric concentrationof carbon dioxide (CO2), in ppm.
Can you please construct a 95% confidence interval for the slope of the regression equation?
Also, what are the chances of seeing a linear relationship at least as strong as observed from these data, when in fact there was none in the population?
What would be the conclusion from this regression?
A sample of 100 bears was treated like it was the whole population of Jellystone Park bears, and the mean weight was found to be 800 pounds with standard deviation 12 pounds, the mean blood pressure was 150 with standard deviation 6, and the sample correlation coefficient of weight with blood pressure was found to be .4. Based on this information, what is the regression slope for the SLR equation for predicting blood pressure using observed weight for Jellystone bears?
I have an 1800 square foot home and based on median price of 628,408, mean listing price $401,398, standard deviation $168,408 and median sq foot of 2108, mean sq foot 2295 and standard deviation sq foot 1128, how do I calculate the regression equation to come up with a listing price for and 1800 sqft home?
Chapter 14 Solutions
Modern Business Statistics with Microsoft Office Excel (with XLSTAT Education Edition Printed Access Card) (MindTap Course List)
Ch. 14.2 - Given are five observations for two variables, x...Ch. 14.2 - Given are five observations for two variables, x...Ch. 14.2 - Given are five observations collected in a...Ch. 14.2 - Retail and Trade: Female Managers. The following...Ch. 14.2 - Production Line Speed and Quality Control. Brawdy...Ch. 14.2 - The National Football League (NFL) records a...Ch. 14.2 - Sales Experience and Performance. A sales manager...Ch. 14.2 - Broker Satisfaction. The American Association of...Ch. 14.2 - Companies in the U.S. car rental market vary...Ch. 14.2 - Age and the Price of Wine. For a particular red...
Ch. 14.2 - Laptop Ratings. To help consumers in purchasing a...Ch. 14.2 - Stock Beta. In June of 2016, Yahoo Finance...Ch. 14.2 - Distance and Absenteeism. A large city hospital...Ch. 14.2 - Using a global-positioning-system (GPS)-based...Ch. 14.3 - 15. The data from exercise 1...Ch. 14.3 - The data from exercise 2 follow.
The estimated...Ch. 14.3 - Prob. 17ECh. 14.3 - Price and Quality of Headphones. The following...Ch. 14.3 - Sales Experience and Sales Performance. In...Ch. 14.3 - Price and Weight of Bicycles. Bicycling, the...Ch. 14.3 - Cost Estimation. An important application of...Ch. 14.3 - 22. Refer to exercise 9, where the following data...Ch. 14.5 - The data from exercise 1 follow.
Compute the mean...Ch. 14.5 - The data from exercise 2 follow.
Compute the mean...Ch. 14.5 - The data from exercise 3 follow.
What is the...Ch. 14.5 - Prob. 26ECh. 14.5 - To identify high-paying jobs for people who do not...Ch. 14.5 - Broker Satisfaction Conclusion. In exercise 8,...Ch. 14.5 - Cost Estimation Conclusion. Refer to exercise 21,...Ch. 14.5 - Significance of Fleet Size on Rental Car Revenue....Ch. 14.5 - Significance of Racing Bike Weight on Price. In...Ch. 14.6 - 32. The data from exercise 1...Ch. 14.6 - 33. The data from exercise 2...Ch. 14.6 - Prob. 34ECh. 14.6 - 35. The following data are the monthly salaries y...Ch. 14.6 - 36. In exercise 7, the data on y = annual sales ($...Ch. 14.6 - In exercise 5, the following data on x = the...Ch. 14.6 - Prob. 38ECh. 14.6 - 39. In exercise 12, the following data on x =...Ch. 14.7 - The commercial division of a real estate firm...Ch. 14.7 - Following is a portion of the regression output...Ch. 14.7 - Prob. 43ECh. 14.7 - Auto Racing Helmet. Automobile racing,...Ch. 14.8 - Prob. 45ECh. 14.8 - Prob. 46ECh. 14.8 - Prob. 47ECh. 14.8 - Prob. 48ECh. 14.8 - Prob. 49ECh. 14.9 - Consider the following data for two variables, x...Ch. 14.9 - Prob. 51ECh. 14.9 - Predicting Charity Expenses. Charity Navigator is...Ch. 14.9 - Many countries, especially those in Europe, have...Ch. 14.9 - Valuation of a Major League Baseball Team. The...Ch. 14 - The Dow Jones Industrial Average (DJIA) and the...Ch. 14 - Home Sire and Price. Is the number of square feet...Ch. 14 - Online Education. One of the biggest changes in...Ch. 14 - Machine Maintenance. Jensen Tire & Auto is in the...Ch. 14 - Bus Maintenance. The regional transit authority...Ch. 14 - Studying and Grades. A marketing professor at...Ch. 14 - Used Car Mileage and Price. The Toyota Camry is...Ch. 14 - One measure of the risk or volatility of an...Ch. 14 - As part of a study on transportation safety, the...Ch. 14 - Consumer Reports tested 166 different...Ch. 14 - When trying to decide what car to buy, real value...Ch. 14 - Buckeye Creek Amusement Park is open from the...
Knowledge Booster


Learn more about
Need a deep-dive on the concept behind this application? Look no further. Learn more about this topic, statistics and related others by exploring similar questions and additional content below.Similar questions
- Test the strength of linear relationship with H0 : b = 0 and H1 : b ̸= 0 using significance level α = 0.05. Forecast the electric resistence when the carbon content is 50% and calculate a prediction interval for the predicted point with 95% confidence.arrow_forwardA researcher was interested in the relationship between the number of texts sent in a day and the number of e-mails sent in a day by employees at a certain company. Using 15 data values, a 90 percent confidence interval for the slope of a regression model was found to be (2.31,3.47). The researcher claims that the interval would have been narrower with a different sample size if all other things remained the same. Which of the following sample sizes would make the researcher’s claim NOT true?arrow_forwardA pharmaceutical company is examining the relationship between dosage of a new pain-relief medication and the time it takes for patients to experience pain relief from a headache. Various dosages ranging from 200 to 1,200 milligrams (mg) in 100-milligram increments were given to 41 randomly selected patients, and the time until relief was measured in minutes. A check of the conditions necessary for inference for the slope of a regression line shows that they are met. A 95 percent confidence interval for the slope of the regression line relating the dosage, x, to the time until relief, y, is given by (−4.15,−2.27). Based on the confidence interval, which of the following claims is supported? A 100 mg increase in dosage results in a decrease in the time until relief by more than two minutes on average. A A 100 mg increase in dosage results in a decrease in the time until relief by more than four minutes on average. B There is not a linear relationship…arrow_forward
- A pharmaceutical company is examining the relationship between dosage of a new pain-relief medication and the time it takes for patients to experience pain relief from a headache. Various dosages ranging from 200 to 1,200 milligrams (mg) in 100-milligram increments were given to 41 randomly selected patients, and the time until relief was measured in minutes. A check of the conditions necessary for inference for the slope of a regression line shows that they are met. A 95 percent confidence interval for the slope of the regression line relating the dosage, x, to the time until relief, y, is given by (−4.15,−2.27). Based on the confidence interval, which of the following claims is supported? A 100 mg increase in dosage results in a decrease in the time until relief by more than two minutes on average. Answer A: A 100 milligram increase in dosage results in a decrease in the time until relief by more than two minutes on average. A A 100 mg increase in dosage…arrow_forwardThe mean change in muscle thickness observed after a 4-week training regimen was 4 mm, and the 95% confidence interval (CI) for mean change was (-0.5, 8.5). Which is the best scientific conclusion for the effectiveness of this regimen ?arrow_forwardAnalyze the residuals from this experiment and comment on model adequacy.arrow_forward
- The Pearson's correlation coefficient (r) between two variables, X and Y, is calculated to be 0.8. Using a two-tailed hypothesis test with a significance level of 0.05, what is the conclusion about the relationship between X and Y?arrow_forwardA Researcher Studying The Relationship Between Maternal Age And Length Of Breastfeeding In A Sample Of 75 Primiparas Found A Correlation Of .19, Which Was Not Statistically Significant At The .05 Level. What Was The Estimated Power Of The Statistical Test? Conversely, What Was The Risk That A Type II Error Was Committed? If .19 Is A Good Estimation Of The Population Correlation, What Sample Size Would Be Needed In A Replication Study To Achieve Power = .80 At Α= .05?arrow_forwardA study is performed to examine the relationship between the concentration of plasma antioxidant vitamins and cancer risk. Table 7-66, shows data for plasma vitamin-A concentration in stomach cancer patients and in controls (participants similar to the cancer patients but free of disease). Is there a significant vitamins between patients with stomach cancer and controls? Run the appropriate test at a 5% level of significance.arrow_forward
- A trial study suggest that the standard deviation for the half life for the drug chlordiazepoxide is 8 hours. With 99% confidence, find the sample size needed to determine the mean half life for the drug with a margin of error of 3 hours.arrow_forwardFind the MSE, the MSR and the F-statistic Based on the F distribution table, can you reject the null hypothesis that the regression is not significant, at a 90% confidence level (α=10%)?arrow_forwardThe 98% confidence interval for the intercept, coefficient of X1, and coefficient of X2 of a linear model with 2 predictors, are (18, 24), (-2,9) and (-1, 3) respectively based on 33 samples. a) What are the t-stats for X1 and X2? b) Is the coefficient of X1 statistically more significant than that of X2?arrow_forward
arrow_back_ios
SEE MORE QUESTIONS
arrow_forward_ios
Recommended textbooks for you
 MATLAB: An Introduction with ApplicationsStatisticsISBN:9781119256830Author:Amos GilatPublisher:John Wiley & Sons Inc
 Probability and Statistics for Engineering and th...StatisticsISBN:9781305251809Author:Jay L. DevorePublisher:Cengage Learning
 Statistics for The Behavioral Sciences (MindTap C...StatisticsISBN:9781305504912Author:Frederick J Gravetter, Larry B. WallnauPublisher:Cengage Learning
 Elementary Statistics: Picturing the World (7th E...StatisticsISBN:9780134683416Author:Ron Larson, Betsy FarberPublisher:PEARSON
 The Basic Practice of StatisticsStatisticsISBN:9781319042578Author:David S. Moore, William I. Notz, Michael A. FlignerPublisher:W. H. Freeman
 Introduction to the Practice of StatisticsStatisticsISBN:9781319013387Author:David S. Moore, George P. McCabe, Bruce A. CraigPublisher:W. H. Freeman
MATLAB: An Introduction with Applications
Statistics
ISBN:9781119256830
Author:Amos Gilat
Publisher:John Wiley & Sons Inc
Probability and Statistics for Engineering and th...
Statistics
ISBN:9781305251809
Author:Jay L. Devore
Publisher:Cengage Learning
Statistics for The Behavioral Sciences (MindTap C...
Statistics
ISBN:9781305504912
Author:Frederick J Gravetter, Larry B. Wallnau
Publisher:Cengage Learning
Elementary Statistics: Picturing the World (7th E...
Statistics
ISBN:9780134683416
Author:Ron Larson, Betsy Farber
Publisher:PEARSON
The Basic Practice of Statistics
Statistics
ISBN:9781319042578
Author:David S. Moore, William I. Notz, Michael A. Fligner
Publisher:W. H. Freeman
Introduction to the Practice of Statistics
Statistics
ISBN:9781319013387
Author:David S. Moore, George P. McCabe, Bruce A. Craig
Publisher:W. H. Freeman
Correlation Vs Regression: Difference Between them with definition & Comparison Chart; Author: Key Differences;https://www.youtube.com/watch?v=Ou2QGSJVd0U;License: Standard YouTube License, CC-BY
Correlation and Regression: Concepts with Illustrative examples; Author: LEARN & APPLY : Lean and Six Sigma;https://www.youtube.com/watch?v=xTpHD5WLuoA;License: Standard YouTube License, CC-BY