
Concept explainers
Videos
Broker Satisfaction Conclusion. In exercise 8, ratings data on x = the quality of the speed of execution and y = overall satisfaction with electronic trades provided the estimated regression equation
8. Broker Satisfaction. The American Association of Individual Investors (AAII) On-Line Discount Broker Survey polls members on their experiences with discount brokers. As part of the survey, members were asked to rate the quality of the speed of execution with their broker as well as provide an overall satisfaction rating for electronic trades. Possible responses (scores) were no opinion (0), unsatisfied (l), somewhat satisfied (2), satisfied (3), and very satisfied (4). For each broker summary scores were computed by calculating a weighted average of the scores provided by each respondent. A portion of the survey results follow (AAII website).
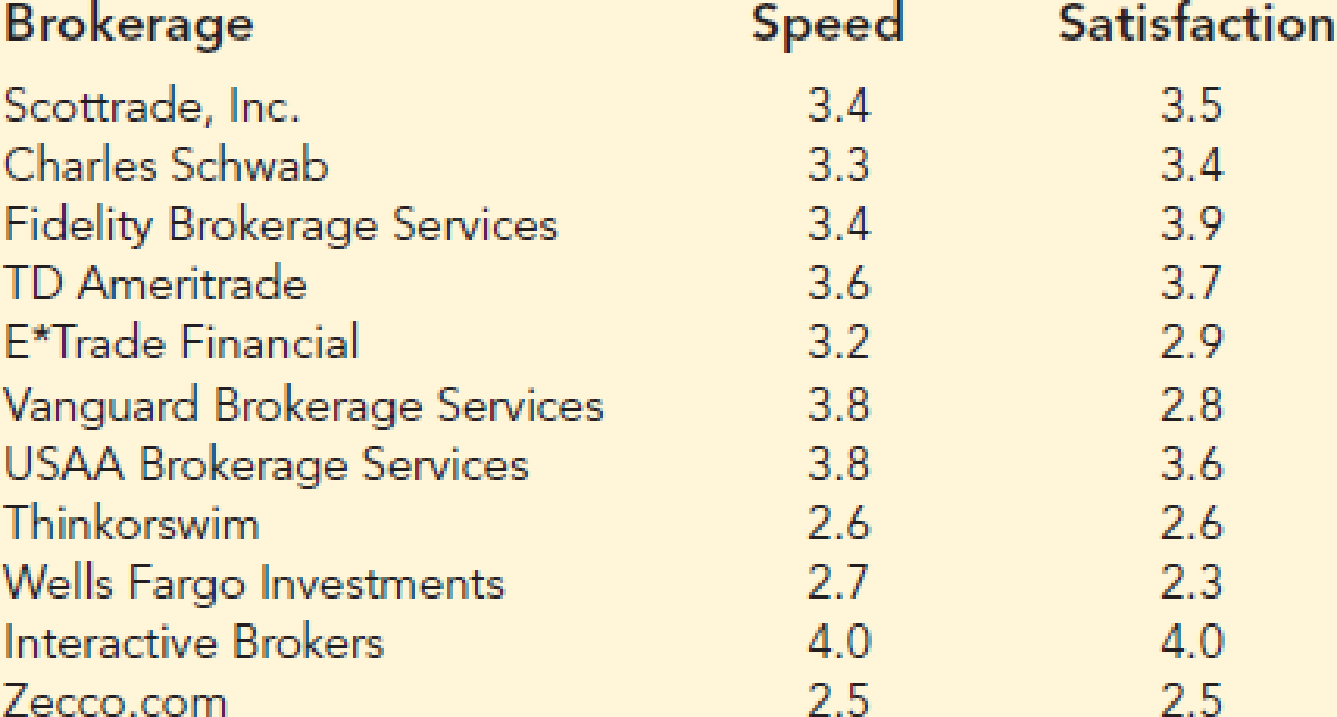
- a. Develop a
scatter diagram for these data with the speed of execution as the independent variable. - b. What does the scatter diagram developed in part (a) indicate about the relationship between the two variables?
- c. Develop the least squares estimated regression equation.
- d. Provide an interpretation for the slope of the estimated regression equation.
- e. Suppose Zecco.com developed new software to increase their speed of execution rating. If the new software is able to increase their speed of execution rating from the current value of 2.5 to the average speed of execution rating for the other 10 brokerage firms that were surveyed, what value would you predict for the overall satisfaction rating?
Want to see the full answer?
Check out a sample textbook solution
Chapter 14 Solutions
Modern Business Statistics with Microsoft Office Excel (with XLSTAT Education Edition Printed Access Card) (MindTap Course List)


- Life Expectancy The following table shows the average life expectancy, in years, of a child born in the given year42 Life expectancy 2005 77.6 2007 78.1 2009 78.5 2011 78.7 2013 78.8 a. Find the equation of the regression line, and explain the meaning of its slope. b. Plot the data points and the regression line. c. Explain in practical terms the meaning of the slope of the regression line. d. Based on the trend of the regression line, what do you predict as the life expectancy of a child born in 2019? e. Based on the trend of the regression line, what do you predict as the life expectancy of a child born in 1580?2300arrow_forwardMultiple regression is sometimes used in litigation. In the case of Cargill, Inc. v. Hardin (1971), the prosecution charged that the cash price of wheat was manipulated in violation of the Commodity Exchange Act. In a statistical study conducted for this case, a multiple regression model was constructed to predict the cash price of wheat using three supply-and-demand explanatory variables: economic growth, population growth, and meat consumption. Data for 24 years were used to construct the regression equation, and a prediction for the suspect period was computed from this equation Based on a significance level of 5%, which of the following independent variables significantly predict the cash price of wheat? a. Economic Growth b. Population Growth c. Meat Consumption d. All the independent variables significantly predict the cash price of wheat.arrow_forwardMultiple regression is sometimes used in litigation. In the case of Cargill, Inc. v. Hardin (1971), the prosecution charged that the cash price of wheat was manipulated in violation of the Commodity Exchange Act. In a statistical study conducted for this case, a multiple regression model was constructed to predict the cash price of wheat using three supply-and-demand explanatory variables: economic growth, population growth, and meat consumption. Data for 24 years were used to construct the regression equation, and a prediction for the suspect period was computed from this equation. The actual cash price of wheat under investigation in 1963 was $2.13. Based on the comparison of the correct predicted cash price calculated in the previous question and the actual cash price, what does the evidence suggest about Cargill, Inc.? a. Because the predicted price is relatively close to the actual price (within one cent), Cargill, Inc. probably did not artificially manipulate the price of wheat.…arrow_forward
- Multiple regression is sometimes used in litigation. In the case of Cargill, Inc. v. Hardin (1971), the prosecution charged that the cash price of wheat was manipulated in violation of the Commodity Exchange Act. In a statistical study conducted for this case, a multiple regression model was constructed to predict the cash price of wheat using three supply-and-demand explanatory variables: economic growth, population growth, and meat consumption. Data for 24 years were used to construct the regression equation, and a prediction for the suspect period was computed from this equation. The following output represents the regression analysis. . Before the judge and jury consider the results of the regression model, they must ensure that the model is valid. What is the proper hypothesis test for this model, and what is the proper conclusion?arrow_forward18)The regression equation is intended to be the “best fitting” straight line for a set of data. Whatis the criterion for “best fitting”?arrow_forwardOnline clothes II For the online clothing retailer dis-cussed in the previous problem, the scatterplot of Total Yearly Purchases by Income showsThe correlation between Total Yearly Purchases and Incomeis 0.722. Summary statistics for the two variables are: a) What is the linear regression equation for predictingTotal Yearly Purchase from Income? b) Do the assumptions and conditions for regression ap-pear to be met? c) What is the predicted average Total Yearly Purchasefor someone with a yearly Income of $20,000? Forsomeone with an annual Income of $80,000?d) What percent of the variability in Total YearlyPurchases is accounted for by this model?e) Do you think the regression might be a useful one forthe company? Comment.arrow_forward
- On the first day of class, an economics professor administers a test to gauge the math preparedness of her students. She believes that the performance on this math test and the number of hours studied per week on the course are the primary factors that predict a student's score on the final exam. Using data from her class of 60 students, she estimates A portion of the regression results is shown in the following table. a. What is the slope coefficient of Hours? b. What is the sample regression equation? c. What is the predicted final exam score for a student who has a math score of 70 and studies 4 hours per week?arrow_forwardIn exercise 20, data on x = weight (pounds) and y = price ($) for ten road-racing bikes provided the estimated regression equation = 28574 -1439x (Bicycling website, March 8, 2012). For these data SSE = 7,102,922.54 and SST = 52,120,800. Use the F test to determine whether the weight for a bike and the price are related at the .05 level of significance. Click on the datafile logo to reference the data. Calculate the value of the test statistic (to 1 decimal). The p-value is - Select your answer -less than .01between .01 and .025between .025 and .05between .05 and .10greater than .10Item 2 . Use Table 1 of Appendix B. What is your conclusion?arrow_forwardConsumer Reports tested 19 different brands and models of road, fitness, and comfort bikes. Road bikes are designed for long road trips; fitness bikes are designed for regular workouts or daily commuters; and comfort bikes are designed for leisure rides on typically flat roads. The data file Bikes show the type, weight (lb.), and price ($) for the 20 bicycles tested. In Minitab, Develop an estimated regression equation that can be used to predict Price by using Type and Weight. At the 0.05 level of significance, test for autocorrelation in the data. Bikes: Brand and Model Type Weight Price Klein Rêve v Road 20 1800 Giant OCR Composite 3 Road 22 1800 Giant OCR 1 Road 22 1000 Specialized Roubaix Road 21 1300 Trek Pilot 2.1 Road 21 1320 Cannondale Synapse 4 Road 21 1050 LeMond Poprad Road 22 1350 Raleigh Cadent 1.0 Road 24 650 Giant FCR3 Fitness 23 630 Schwinn Super Sport GS Fitness 23 700 Fuji Absolute 2.0 Fitness 24 700 Jamis Coda Comp Fitness 26 830…arrow_forward
- The Mayor of texas whom is partners with a local agriculturalist wants to know how the amount of fertilizer and the amount of water given to plants affect their growth. The results were inputted into MINITAB so as to fit the model a) Write out the regression equation b) What is the sample size used in this investigation? c) Determine the values of *, ** and ***, **** d) Conduct a hypothesis test, at the 5% level of significance, to determine whether ? is significant. e) What would be the growth of the plant if 4g of fertilizer and 7g of ater was given to it daily? f) Carry out an F -test at the 1% significance level to determine whether the model is significantarrow_forwardDetermine the statistical test that should be conducted before conducting linear regression? a. Normality test b. Variance Homogeneity test c. Correlation d. Data transformationarrow_forwardThe Conde Nast Traveler Gold List for 2012 provided rating for the top 20 small cruise ships. The data from annual Readers’ Choice Survey are the overall scores(Y) each ship received based on several criteria, including Itineraries/Schedule (X1), Shore Excursions(X2), and Food/Dinning(X3). The estimated regression equation to predict the overall scores is Y= 35.6184+0.1105 X1+0.2445 X2+0.2474 X3. Part of the regression results is shown below. Coefficients Standard Error Intercept 35.6184 13.2308 Itineraries/Schedule(X1) 0.1105 0.1297 Shore Excursions(X2) 0.2445 0.0434 Food/Dinning(X3) 0.2474 0.0621 Use the T test to determine whether or not the coefficient of X1 is significant. Use Level of significance=.05? Be sure to state null and alternative hypotheses.…arrow_forward
 Functions and Change: A Modeling Approach to Coll...AlgebraISBN:9781337111348Author:Bruce Crauder, Benny Evans, Alan NoellPublisher:Cengage Learning
 Big Ideas Math A Bridge To Success Algebra 1: Stu...AlgebraISBN:9781680331141Author:HOUGHTON MIFFLIN HARCOURTPublisher:Houghton Mifflin Harcourt
 Glencoe Algebra 1, Student Edition, 9780079039897...AlgebraISBN:9780079039897Author:CarterPublisher:McGraw Hill