MyLab Accounting with Pearson eText -- Access Card -- for Horngren's Cost Accounting
16th Edition
ISBN: 9780134476384
Author: Srikant M. Datar, Madhav V. Rajan
Publisher: PEARSON
expand_more
expand_more
format_list_bulleted
Videos
Textbook Question
Chapter 19, Problem 19.18E
Costs of quality. (CMA, adapted) Osborn, Inc., produces cell phone equipment. Amanda Westerly, Osborn’s president, implemented a quality-improvement program that has now been in operation for 2 years. The cost report shown here has recently been issued.
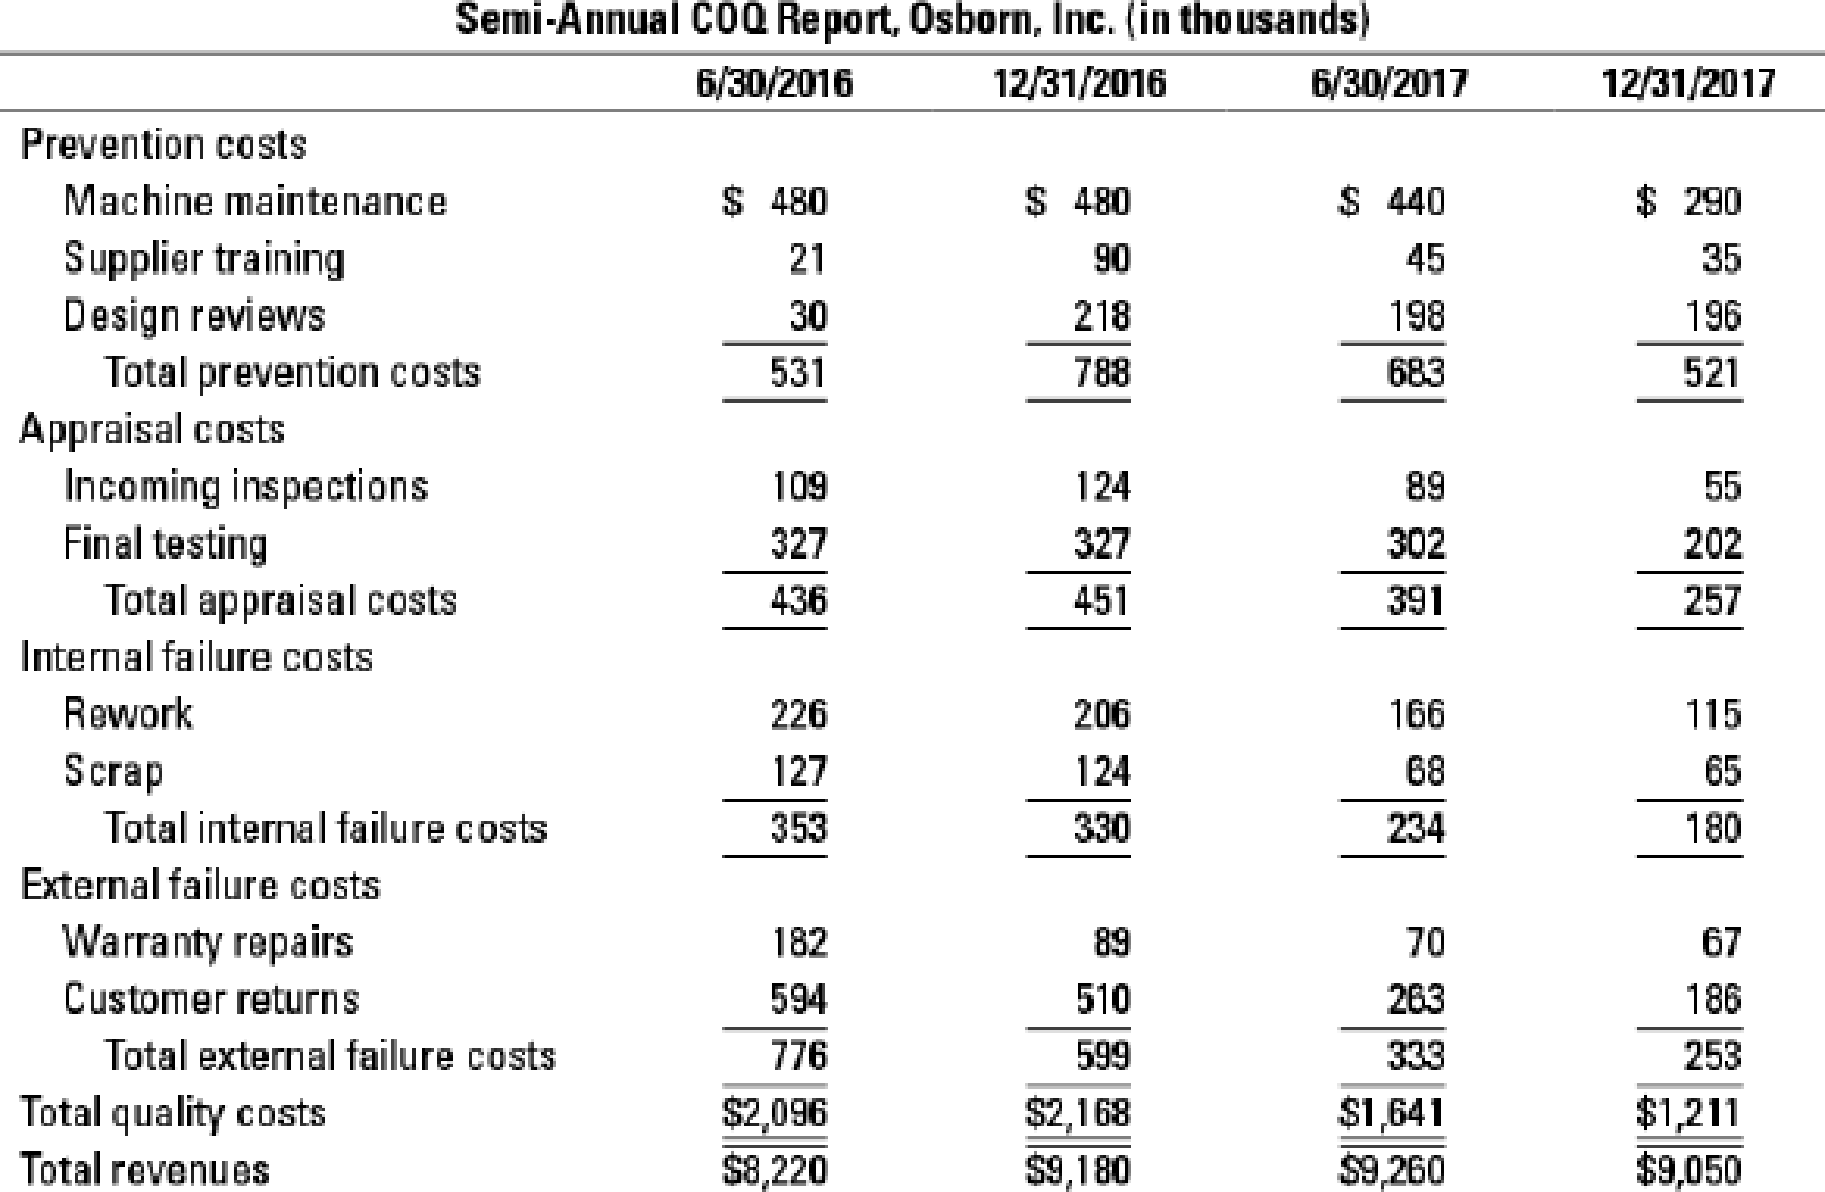
- 1. For each period, calculate the ratio of each COQ category to revenues and to total quality costs.
Required
- 2. Based on the results of requirement 1, would you conclude that Osborn’s quality program has been successful? Prepare a short report to present your case.
- 3. Based on the 2015 survey, Amanda Westerly believed that Osborn had to improve product quality. In making her case to Osborn management, how might Westerly have estimated the opportunity cost of not implementing the quality-improvement program?
Expert Solution & Answer

Trending nowThis is a popular solution!

Students have asked these similar questions
How Can I resolve this problem?
Walton Company has measured its quality costs for the past two years. After the company gathers its quality cost data, it summarizes those costs using the four categories shown below:
Required:
3. For this year, calculate the cost in each of the four categories as a percent of the total cost of quality.
4a. Calculate the change in total cost of quality over the two-year period.
Last Year
This Year
Prevention costs
$
339,200
$
637,000
Appraisal costs
$
467,300
$
496,000
Internal failure costs
$
853,200
$
545,000
External failure costs
$
1,001,000
$
734,400
Costs of quality. (CMA, adapted) Osborn, Inc., produces cell phone equipment. Amanda Westerly, Osborn’s president, implemented a quality-improvement program that has now been in operation for 2 years. The cost report shown here has recently been issued.
At the beginning of the year, Kowalski Company initiated a quality improvement program. The program was successful in reducing scrap and rework costs. To help assess the impact of the quality improvement program, the following data were collected for the current and preceding years:
Preceding Year
Current Year
Sales
$3,000,000
$3,000,000
Quality training
3,000
4,500
Material inspections
7,500
12,000
Scrap
60,000
45,000
Rework
120,000
75,000
Product inspection
15,000
30,000
Product warranty
105,000
82,500
If quality costs had been reduced to 2.5 percent of sales in the current year, profits would have increased by
a.$174,000.
b.$91,500.
c.$37,500.
d.$255,000.
Chapter 19 Solutions
MyLab Accounting with Pearson eText -- Access Card -- for Horngren's Cost Accounting
Ch. 19 - Describe two benefits of improving quality.Ch. 19 - Prob. 19.2QCh. 19 - Name two items classified as prevention costs.Ch. 19 - Give two examples of appraisal costs.Ch. 19 - Distinguish between internal failure costs and...Ch. 19 - Describe three methods that companies use to...Ch. 19 - Companies should focus on financial measures of...Ch. 19 - Give two examples of nonfinancial measures of...Ch. 19 - Give two examples of nonfinancial measures of...Ch. 19 - When evaluating alternative ways to improve...
Ch. 19 - Distinguish between customer-response time and...Ch. 19 - Prob. 19.12QCh. 19 - Give two reasons why delays occur.Ch. 19 - Companies should always make and sell all products...Ch. 19 - Prob. 19.15QCh. 19 - Rector Corporation is examining its quality...Ch. 19 - Six Sigma is a continuous quality improvement...Ch. 19 - Costs of quality. (CMA, adapted) Osborn, Inc.,...Ch. 19 - Costs of quality analysis. Adirondack Company...Ch. 19 - Costs-of-quality analysis. Safe Travel produces...Ch. 19 - Costs of quality, quality improvement. iCover...Ch. 19 - Prob. 19.22ECh. 19 - Prob. 19.23ECh. 19 - Waiting time. Its a Dogs World (IDW) makes toys...Ch. 19 - Waiting time, service industry. The registration...Ch. 19 - Waiting time, cost considerations, customer...Ch. 19 - Nonfinancial measures of quality and time. For the...Ch. 19 - Nonfinancial measures of quality, manufacturing...Ch. 19 - Statistical quality control. Harvest Cereals...Ch. 19 - Quality improvement, Pareto diagram,...Ch. 19 - Quality improvement, relevant costs, and relevant...Ch. 19 - Quality improvement, relevant costs, and relevant...Ch. 19 - Waiting times, manufacturing cycle times. The...Ch. 19 - Prob. 19.34PCh. 19 - Manufacturing cycle times, relevant revenues, and...Ch. 19 - Compensation linked with profitability, waiting...Ch. 19 - Ethics and quality. Weston Corporation...Ch. 19 - Prob. 19.38P
Knowledge Booster


Learn more about
Need a deep-dive on the concept behind this application? Look no further. Learn more about this topic, accounting and related others by exploring similar questions and additional content below.Similar questions
- In 20x4, Tru-Delite Frozen Desserts, Inc., instituted a quality improvement program. At the end of 20x5, the management of the corporation requested a report to show the amount saved by the measures taken during the year. The actual sales and quality costs for 20x4 and 20x5 are as follows: Tru-Delites management believes that quality costs can be reduced to 2.5 percent of sales within the next five years. At the end of 20x9, Tru-Delites sales are projected to grow to 750,000. The projected relative distribution of quality costs at the end of 20x9 is as follows: Required: 1. Profits increased by what amount due to quality improvements made in 20x5? 2. Prepare a long-range performance report that compares the quality costs incurred at the end of 20x5 with the quality cost structure expected at the end of 20x9. 3. Are the targeted costs in the year 20x9 all value-added costs? How would you interpret the variances if the targeted costs are value-added costs? 4. What would be the profit increase in 20x9 if the 2.5 percent performance standard is met in that year?arrow_forwardGagnon Company reported the following sales and quality costs for the past four years. Assume that all quality costs are variable and that all changes in the quality cost ratios are due to a quality improvement program. Required: 1. Compute the quality costs for all four years. By how much did net income increase from Year 1 to Year 2 because of quality improvements? From Year 2 to Year 3? From Year 3 to Year 4? 2. The management of Gagnon Company believes it is possible to reduce quality costs to 2.5 percent of sales. Assuming sales will continue at the Year 4 level, calculate the additional profit potential facing Gagnon. Is the expectation of improving quality and reducing costs to 2.5 percent of sales realistic? Explain. 3. Assume that Gagnon produces one type of product, which is sold on a bid basis. In Years 1 and 2, the average bid was 400. In Year 1, total variable costs were 250 per unit. In Year 3, competition forced the bid to drop to 380. Compute the total contribution margin in Year 3 assuming the same quality costs as in Year 1. Now, compute the total contribution margin in Year 3 using the actual quality costs for Year 3. What is the increase in profitability resulting from the quality improvements made from Year 1 to Year 3?arrow_forwardNabors Company had actual quality costs for the year ended June 30, 20x5, as given below. At the zero-defect state, Nabors expects to spend 375,000 on quality engineering, 75,000 on vendor certification, and 50,000 on packaging inspection. Assume sales to be 25,000,000. Required: 1. Prepare a long-range performance report for 20x5. What does this report tell the management of Nabors? 2. Explain why quality costs still are present for the zero-defect state. 3. What if Nabors achieves the zero-defect state reflected in the report? What are some of the implications of this achievement?arrow_forward
- The controller of Emery, Inc. has computed quality costs as a percentage of sales for the past 5 years (20X1 was the first year the company implemented a quality improvement program). This information is as follows: Required: 1. Prepare a trend graph for total quality costs. Comment on what the graph has to say about the success of the quality improvement program. 2. Prepare a graph that shows the trend for each quality cost category. What does the graph have to say about the success of the quality improvement program? Does this graph supply more insight than the total cost trend graph does? 3. Prepare a graph that compares the trend in relative control costs versus relative failure costs. Comment on the significance of this trend.arrow_forwardIn 20X1, Don Blackburn, president of Price Electronics, received a report indicating that quality costs were 31% of sales. Faced with increasing pressures from imported goods. Don resolved to take measures to improve the overall quality of the companys products. After hiring a consultant in 20X1, the company began an aggressive program of total quality control. At the end of 20X5, Don requested an analysis of the progress the company had made in reducing and controlling quality costs. The accounting department assembled the following data: Required: 1. Compute the quality costs as a percentage of sales by category and in total for each year. 2. Prepare a multiple-year trend graph for quality costs, both by total costs and by category. Using the graph, assess the progress made in reducing and controlling quality costs. Does the graph provide evidence that quality has improved? Explain. 3. Using the 20X1 quality cost relationships (assume all costs are variable), calculate the quality costs that would have prevailed in 20X4. By how much did profits increase in 20X4 because of the quality improvement program? Repeat for 20X5.arrow_forwardIn 20x5, Major Company initiated a full-scale, quality improvement program. At the end of the year, Jack Aldredge, the president, noted with some satisfaction that the defects per unit of product had dropped significantly compared to the prior year. He was also pleased that relationships with suppliers had improved and defective materials had declined. The new quality training program was also well accepted by employees. Of most interest to the president, however, was the impact of the quality improvements on profitability. To help assess the dollar impact of the quality improvements, the actual sales and the actual quality costs for 20x4 and 20x5 are as follows by quality category: All prevention costs are fixed (by discretion). Assume all other quality costs are unit-level variable. Required: 1. Compute the relative distribution of quality costs for each year and prepare a pie chart. Do you believe that the company is moving in the right direction in terms of the balance among the quality cost categories? Explain. 2. Prepare a one-year trend performance report for 20x5 (compare the actual costs of 20x5 with those of 20x4, adjusted for differences in sales volume). How much have profits increased because of the quality improvements made by Major Company? 3. Estimate the additional improvement in profits if Major Company ultimately reduces its quality costs to 2.5 percent of sales revenues (assume sales of 10 million).arrow_forward
- Suppose that Kicker had the following sales and cost experience (in thousands of dollars) for May of the current year and for May of the prior year: In May of the prior year, Kicker started an intensive quality program designed to enable it to build original equipment manufacture (OEM) speaker systems for a major automobile company. The program was housed in research and development. In the beginning of the current year, Kickers accounting department exercised tighter control over sales commissions, ensuring that no dubious (e.g., double) payments were made. The increased sales in the current year required additional warehouse space that Kicker rented in town. (Round ratios to four decimal places. Round sales dollars computations to the nearest dollar.) Required: 1. Calculate the contribution margin ratio for May of both years. 2. Calculate the break-even point in sales dollars for both years. 3. Calculate the margin of safety in sales dollars for both years. 4. CONCEPTUAL CONNECTION Analyze the differences shown by your calculations in Requirements 1, 2, and 3.arrow_forwardLuna Company is a printing company and a subsidiary of a large publishing company. Luna is in its fourth year of a 5-year, quality improvement program. The program began in 20X1 as a result of a report by a consulting firm that revealed that quality costs were about 20% of sales. Concerned about the level of quality costs, Lunas top management began a 5-year plan in 20X1 with the objective of lowering quality costs to 10% of sales by the end of 20X5. Sales and quality costs for each year are as follows: Quality costs by category are expressed as a percentage of sales as follows: The detail of the 20X5 budget for quality costs is also provided. Actual quality costs for 20X4 and 20X5 are as follows: Required: 1. Prepare an interim quality cost performance report for 20X5 that compares actual quality costs with budgeted quality costs. Comment on the firms ability to achieve its quality goals for the year. 2. Prepare a single-period quality performance report for 20X5 that compares the actual quality costs of 20X4 with the actual costs of 20X5. How much did profits change because of improved quality? 3. Prepare a graph that shows the trend in total quality costs as a percentage of sales since the inception of the quality improvement program. 4. Prepare a graph that shows the trend for all four quality cost categories for 20X1 through 20X5. How does this graph help management know that the reduction in total quality costs is attributable to quality improvements? 5. Assume that the company is preparing a second 5-year plan to reduce quality costs to 2.5% of sales. Prepare a long-range quality cost performance report that compares the costs for 20X5 with those planned for the end of the second 5-year period. Assume sales of 45 million at the end of 5 years. The final planned relative distribution of quality costs is as follows: proofreading, 50%; other inspection, 13%; quality training, 30%; and quality reporting, 7%. Assume that all prevention costs are fixed and all other costs are variable (with respect to sales).arrow_forwardAt the end of 20x1, Mejorar Company implemented a low-cost strategy to improve its competitive position. Its objective was to become the low-cost producer in its industry. A Balanced Scorecard was developed to guide the company toward this objective. To lower costs, Mejorar undertook a number of improvement activities such as JIT production, total quality management, and activity-based management. Now, after two years of operation, the president of Mejorar wants some assessment of the achievements. To help provide this assessment, the following information on one product has been gathered: Required: 1. Compute the following measures for 20x1 and 20x3: a. Actual velocity and cycle time b. Percentage of total revenue from new customers (assume one unit per customer) c. Percentage of very satisfied customers (assume each customer purchases one unit) d. Market share e. Percentage change in actual product cost (for 20x3 only) f. Percentage change in days of inventory (for 20x3 only) g. Defective units as a percentage of total units produced h. Total hours of training i. Suggestions per production worker j. Total revenue k. Number of new customers 2. For the measures listed in Requirement 1, list likely strategic objectives, classified according to the four Balance Scorecard perspectives. Assume there is one measure per objective.arrow_forward
- Muskogee Company had sales of 60,000,000 in 20x1. In 20x5, sales had increased to 75,000,000. A quality improvement program was implemented at the beginning of 20x1. Overall conformance quality was targeted for improvement. The quality costs for 20x1 and 20x5 follow. Assume any changes in quality costs are attributable to improvements in quality. Required: 1. Compute the quality cost-to-sales ratio for each year. Is this type of improvement possible? 2. Calculate the relative distribution of costs by category for 20x1. What do you think of the way costs are distributed? (A pie chart or bar graph may be of some help.) How do you think they will be distributed as the company approaches a zero-defects state? 3. Calculate the relative distribution of costs by category for 20x5. What do you think of the level and distribution of quality costs? (A pie chart or bar graph may be of some help.) Do you think further reductions are possible? 4. The quality manager for Muskogee indicated that the external failure costs reported are only the measured costs. He argued that the 20x5 external costs were much higher than those reported and that additional investment ought to be made in control costs. Discuss the validity of his viewpoint. 5. Suppose that the manager of Muskogee received a bonus equal to 10 percent of the quality cost savings each year. Do you think that gainsharing is a good or a bad idea? Discuss the risks of gainsharing.arrow_forwardAt the beginning of the last quarter of 20x1, Youngston, Inc., a consumer products firm, hired Maria Carrillo to take over one of its divisions. The division manufactured small home appliances and was struggling to survive in a very competitive market. Maria immediately requested a projected income statement for 20x1. In response, the controller provided the following statement: After some investigation, Maria soon realized that the products being produced had a serious problem with quality. She once again requested a special study by the controllers office to supply a report on the level of quality costs. By the middle of November, Maria received the following report from the controller: Maria was surprised at the level of quality costs. They represented 30 percent of sales, which was certainly excessive. She knew that the division had to produce high-quality products to survive. The number of defective units produced needed to be reduced dramatically. Thus, Maria decided to pursue a quality-driven turnaround strategy. Revenue growth and cost reduction could both be achieved if quality could be improved. By growing revenues and decreasing costs, profitability could be increased. After meeting with the managers of production, marketing, purchasing, and human resources, Maria made the following decisions, effective immediately (end of November 20x1): a. More will be invested in employee training. Workers will be trained to detect quality problems and empowered to make improvements. Workers will be allowed a bonus of 10 percent of any cost savings produced by their suggested improvements. b. Two design engineers will be hired immediately, with expectations of hiring one or two more within a year. These engineers will be in charge of redesigning processes and products with the objective of improving quality. They will also be given the responsibility of working with selected suppliers to help improve the quality of their products and processes. Design engineers were considered a strategic necessity. c. Implement a new process: evaluation and selection of suppliers. This new process has the objective of selecting a group of suppliers that are willing and capable of providing nondefective components. d. Effective immediately, the division will begin inspecting purchased components. According to production, many of the quality problems are caused by defective components purchased from outside suppliers. Incoming inspection is viewed as a transitional activity. Once the division has developed a group of suppliers capable of delivering nondefective components, this activity will be eliminated. e. Within three years, the goal is to produce products with a defect rate less than 0.10 percent. By reducing the defect rate to this level, marketing is confident that market share will increase by at least 50 percent (as a consequence of increased customer satisfaction). Products with better quality will help establish an improved product image and reputation, allowing the division to capture new customers and increase market share. f. Accounting will be given the charge to install a quality information reporting system. Daily reports on operational quality data (e.g., percentage of defective units), weekly updates of trend graphs (posted throughout the division), and quarterly cost reports are the types of information required. g. To help direct the improvements in quality activities, kaizen costing is to be implemented. For example, for the year 20x1, a kaizen standard of 6 percent of the selling price per unit was set for rework costs, a 25 percent reduction from the current actual cost. To ensure that the quality improvements were directed and translated into concrete financial outcomes, Maria also began to implement a Balanced Scorecard for the division. By the end of 20x2, progress was being made. Sales had increased to 26,000,000, and the kaizen improvements were meeting or beating expectations. For example, rework costs had dropped to 1,500,000. At the end of 20x3, two years after the turnaround quality strategy was implemented, Maria received the following quality cost report: Maria also received an income statement for 20x3: Maria was pleased with the outcomes. Revenues had grown, and costs had been reduced by at least as much as she had projected for the two-year period. Growth next year should be even greater as she was beginning to observe a favorable effect from the higher-quality products. Also, further quality cost reductions should materialize as incoming inspections were showing much higher-quality purchased components. Required: 1. Identify the strategic objectives, classified by the Balanced Scorecard perspective. Next, suggest measures for each objective. 2. Using the results from Requirement 1, describe Marias strategy using a series of if-then statements. Next, prepare a strategy map. 3. Explain how you would evaluate the success of the quality-driven turnaround strategy. What additional information would you like to have for this evaluation? 4. Explain why Maria felt that the Balanced Scorecard would increase the likelihood that the turnaround strategy would actually produce good financial outcomes. 5. Advise Maria on how to encourage her employees to align their actions and behavior with the turnaround strategy.arrow_forwardWalton Company has measured its quality costs for the past two years. After the company gathers its quality cost data, it summarizes those costs using the four categories shown below: Last Year This Year Prevention costs $ 357,000 $ 650,000 Appraisal costs $ 445,000 $ 545,000 Internal failure costs $ 790,000 $ 500,000 External failure costs $ 1,100,000 $ 680,000 Required:1. Calculate the total cost of quality last year and this year. 2. For last year, calculate the cost in each of the four categories as a percent of the total cost of quality. (Round your answers to 1 decimal place.) 3. For this year, calculate the cost in each of the four categories as a percent of the total cost of quality. (Round your answers to 1 decimal place.) 4-a. Calculate the change in total cost of quality over the two-year period. 4-b. Is performance trending in a favorable or unfavorable direction?multiple choice Favorable Unfavorablearrow_forward
arrow_back_ios
SEE MORE QUESTIONS
arrow_forward_ios
Recommended textbooks for you
 Cornerstones of Cost Management (Cornerstones Ser...AccountingISBN:9781305970663Author:Don R. Hansen, Maryanne M. MowenPublisher:Cengage Learning
 Managerial Accounting: The Cornerstone of Busines...AccountingISBN:9781337115773Author:Maryanne M. Mowen, Don R. Hansen, Dan L. HeitgerPublisher:Cengage Learning
Cornerstones of Cost Management (Cornerstones Ser...
Accounting
ISBN:9781305970663
Author:Don R. Hansen, Maryanne M. Mowen
Publisher:Cengage Learning
Managerial Accounting: The Cornerstone of Busines...
Accounting
ISBN:9781337115773
Author:Maryanne M. Mowen, Don R. Hansen, Dan L. Heitger
Publisher:Cengage Learning
Understanding Systems Development Life Cycle; Author: GreggU;https://www.youtube.com/watch?v=shNOYFlmBOU;License: Standard Youtube License