
Videos
Consider the study described in the previous exercise.
- a. Is the conclusion—that reasoning using information displayed on a small screen is improved by turning the screen to landscape orientation—appropriate, given the study design? Explain.
- b. Is it reasonable to generalize the conclusions from this study to some larger population? If so, what population?
The paper “Turning to Learn: Screen Orientation and Reasoning from Small Devices” (Computers in Human Behavior [2011]: 793–797) describes a study that investigated whether cell phones with small screens are useful for gathering information. The researchers wondered if the ability to reason using information read on a small screen was affected by the screen orientation. The researchers assigned 33 undergraduate students who were enrolled in a psychology course at a large public university to one of two groups at random.
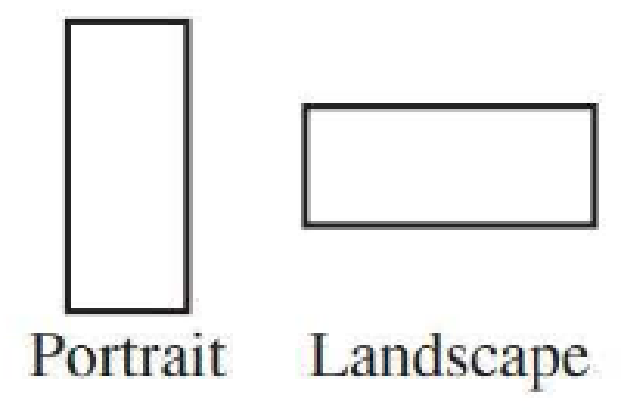
One group read material that was displayed on a small screen in portrait orientation, and the other group read material on the same size screen but turned to display the information in landscape orientation (see figure below).
The researchers found that performance on a reasoning test that was based on the displayed material was better for the group that read material in the landscape orientation.
Want to see the full answer?
Check out a sample textbook solution
Chapter 2 Solutions
Introduction To Statistics And Data Analysis
Additional Math Textbook Solutions
Developmental Mathematics (9th Edition)
Elementary Statistics Using the TI-83/84 Plus Calculator, Books a la Carte Edition (4th Edition)
Statistics for Business & Economics, Revised (MindTap Course List)
Elementary Statistics: A Step By Step Approach
Essential Statistics
Fundamentals of Statistics (5th Edition)


- In a study examining the permanence of academic learning, Bahrick and Hall (1991) tested knowledge of high school algebra for two groups of participants 50 years after they graduated from high school. One group had received additional college math courses and the other group had received no advanced math courses in college. The following table shows data similar to Bahrick and Halls results. No College Math Additional Math n = 4 n = 8 M = 42 M = 50 s2 = 33.333 s2 = 20 1) Do the data indicate a significant difference between the two groups? Use a two- tailed test with α = .05. Report and interpret r2.arrow_forwardIn a study conducted to investigate browsing activity by shoppers, each shopper was initially classified as a nonbrowser, light browser, or heavy browser. For each shopper, the study obtained a measure to determine how comfortable the shopper was in a store. Higher scores indicated greater comfort. Suppose the following data were collected. Light Heavy Nonbrowser Browser Browser 6 5 9 7 6 11 8 5 9 5 4 11 5 7 8 6 4 10 7 6 9 6 5 11 a. Use to test for a difference among mean comfort scores for the three types of browsers. Compute the values identified below (to 2 decimals, if necessary). Sum of Squares, Treatment Sum of Squares, Error Mean Squares, Treatment Mean Squares, Error Calculate the value of the test statistic (to 2 decimals, if necessary). The p-value is: less than .01 between .01 and .025 between .025 and .05 between .05 and .10 greater than .10 What is your conclusion? Conclude…arrow_forwardIn a study conducted to investigate browsing activity by shoppers, each shopper was initially classified as a nonbrowser, light browser, or heavy browser. For each shopper, the study obtained a measure to determine how comfortable the shopper was in a store. Higher scores indicated greater comfort. Suppose the following data were collected. Light Heavy Nonbrowser Browser Browser 6 5 10 7 6 12 8 5 10 5 4 12 5 7 9 6 4 11 7 6 10 6 5 12 a. Use to test for a difference among mean comfort scores for the three types of browsers. Compute the values identified below (to 2 decimals, if necessary). Sum of Squares, Treatment Sum of Squares, Error Mean Squares, Treatment Mean Squares, Error Calculate the value of the test statistic (to 2 decimals, if necessary). The -value is What is your conclusion? b. Use Fisher's LSD procedure to compare the comfort levels of nonbrowsers and light browsers. Use . Compute…arrow_forward
- In 2010, Seery, Holman, & Silver found that individuals with some history of adversity report better mental health and well-being compared to people with little to no history of adversity. In an attempt to examine this phenomenon, a researcher surveys a group of college students to determine the negative life events they experienced in the last 5 years and their current feeling of well-being. Participants: With 5-10 negative experiences With 2 or fewer negative experiences n=7 n=7 Well-being score of M=48 Well-being score of M=41 SS=325 SS=347 1. State the hypotheses both experimental and statistical 2. Do the results indicate significantly different reports of Well-being? Use a two-tailed test with a=.05. Please show work and state your decision regarding the H0. 3. Compute the estimated Cohen's d to measure the size of the effect. State…arrow_forwardThe following data are obtained from a study that seeks to investigate theeffects of an intervention program and the extent of their physical disability on their reading, math and IQ scores. The students who had been recipients of an intervention program are in the treatment group and while those who are not are in the control group. Questions:1. Is there a significant difference in the math, reading and IQ scores ofstudents in the treatment and controlgroups?2. Is the intervention program effective?3. Is there a significant difference in the math, reading and IQ scores ofstudentswhen they are grouped according to the extent of their physicaldisability?4. Isthereasignificantinteractionbetweentreatmentandextentofdisabilityonthe students’ reading, math and IQscores?arrow_forwardA paper investigated the driving behavior of teenagers by observing their vehicles as they left a high school parking lot and then again at a site approximately 1 2 mile from the school. Assume that it is reasonable to regard the teen drivers in this study as representative of the population of teen drivers. MaleDriver FemaleDriver 1.3 -0.3 1.3 0.6 0.9 1.1 2.1 0.7 0.7 1.1 1.3 1.2 3 0.1 1.3 0.9 0.6 0.5 2.1 0.5 (a) Use a .01 level of significance for any hypothesis tests. Data consistent with summary quantities appearing in the paper are given in the table. The measurements represent the difference between the observed vehicle speed and the posted speed limit (in miles per hour) for a sample of male teenage drivers and a sample of female teenage drivers. (Use ?males − ?females. Round your test statistic to two decimal places. Round your degrees of freedom down to the nearest whole number. Round your p-value to three decimal places.) t = df =…arrow_forward
- In a study conducted to investigate browsing activity by shoppers, each shopper was initially classified as a nonbrowser, light browser, or heavy browser. For each shopper, the study obtained a measure to determine how comfortable the shopper was in a store. Higher scores indicated greater comfort. Suppose the following data were collected. Light Heavy Nonbrowser Browser Browser 9 8 3 10 9 5 11 8 3 8 7 5 8 10 2 9 7 4 10 9 3 9 8 5 a. Use a=.05 to test for a difference among mean comfort scores for the three types of browsers. Compute the values identified below (to 2 decimals, if necessary). Sum of Squares, Treatment Sum of Squares, Error Mean Squares, Treatment Mean Squares, Error Calculate the value of the test statistic (to 2 decimals, if necessary). b. Use Fisher's LSD procedure to compare the comfort levels of nonbrowsers and light browsers. Use a=.05 . Compute the LSD critical value (to 2…arrow_forwardA paper investigated the driving behavior of teenagers by observing their vehicles as they left a high school parking lot and then again at a site approximately 1 2 mile from the school. Assume that it is reasonable to regard the teen drivers in this study as representative of the population of teen drivers. MaleDriver FemaleDriver 1.4 -0.2 1.2 0.5 0.9 1.1 2.1 0.7 0.7 1.1 1.3 1.2 3 0.1 1.3 0.9 0.6 0.5 2.1 0.5 (a) Use a .01 level of significance for any hypothesis tests. Data consistent with summary quantities appearing in the paper are given in the table. The measurements represent the difference between the observed vehicle speed and the posted speed limit (in miles per hour) for a sample of male teenage drivers and a sample of female teenage drivers. (Use ?males − ?females. Round your test statistic to two decimal places. Round your degrees of freedom down to the nearest whole number. Round your p-value to three decimal places.) t = df =…arrow_forwardA school psychologist is interested in whether going to nature school, where children spend their day outside working with nature, versus public school has an effect on children's empathy toward their peers. A national survey of public schools found that, on a scale from 1 to 10, the average empathy among all children in public schools was 5 (u = 5.00). The school psychologist randomly selects 4 children from a nature school, measures their empathy toward their peers, and obtains the following scores: 10, 9, 10, 7 Using the appropriate hypothesis test and the six steps of hypothesis testing, see what the school psychologist should conclude about the difference in empathy between children who attend nature school versus children who attend public school. 1. What is the appropriate test to use ? 2. List the test's assumptions You do NOT have to test the assumptions. 3. What are the null and alternative hypotheses ? 4. Construct a sampling distribution of means representing the null…arrow_forward
- A school psychologist is interested in whether going to nature school, where children spend their day outside working with nature, versus public school has an effect on children's empathy toward their peers. A national survey of public schools found that, on a scale from 1 to 10, the average empathy among all children in public schools was 5 (u = 5.00). The school psychologist randomly selects 4 children from a nature school, measures their empathy toward their peers, and obtains the following scores: 10, 9, 10, 7 Using the appropriate hypothesis test and the six steps of hypothesis testing, see what the school psychologist should conclude about the difference in empathy between children who attend nature school versus children who attend public school. 3. What are the null and alternative hypotheses ? 4. Construct a sampling distribution of means representing the null hypothesis. Specify the sampling distribution's mean and standard error 5. Using a two-tailed alpha of .05 (a=0.5)…arrow_forwardA school psychologist is interested in whether going to nature school, where children spend their day outside working with nature, versus public school has an effect on children's empathy toward their peers. A national survey of public schools found that, on a scale from 1 to 10, the average empathy among all children in public schools was 5 (u = 5.00). The school psychologist randomly selects 4 children from a nature school, measures their empathy toward their peers, and obtains the following scores: 10, 9, 10, 7 Using the appropriate hypothesis test and the six steps of hypothesis testing, see what the school psychologist should conclude about the difference in empathy between children who attend nature school versus children who attend public school. 1. What is the appropriate test to use? 2. List the test's assumptions You do NOT have to test the assumptions. 3. What are the null and alternative hypotheses? 4. Construct a sampling distribution of means representing the null…arrow_forwardThe popular show 13 Reasons Why is organized around the suicide of the 17-year-old Hannah, In the show, Hannah herself describes reasons why she decided to kill herself. One of the early episodes originally depicted her suicide in graphic detail. Some critics and mental health advocates argued that the series represented suicide irresponsibly and worried that the show would lead to copycat suicides or self-harm. To test the effect of the show, Niederkrotenthaler et al. (2019) first used social media to determine the exact months of the year when the show was being discussed. They found that public attention was highest during April 2017. What type of design did they use? Group of answer choices Interrupted time-series design Nonequivalent control group posttest-only design Quasi-independent variable None of the abovearrow_forward
 Holt Mcdougal Larson Pre-algebra: Student Edition...AlgebraISBN:9780547587776Author:HOLT MCDOUGALPublisher:HOLT MCDOUGAL