
Concept explainers
Videos
Improving Service Time at Dave’s Burgers
Dave’s Burgers is a fast-food restaurant franchise in Georgia, South Carolina, and North Carolina. Recently, Dave’s Burgers has followed the lead of larger franchise restaurants like Burger King, McDonald’s, and Wendy’s and constructed drive-through windows at all its locations. However, instead of making Dave’s Burgers more competitive, the drive-through windows have been a source of continual problems and it has lost market share to its larger competitors in almost all locations. To identify and correct the problems, top management has selected three of its restaurants (one in each state) as test sites and has implemented a
The Charlotte Dave’s Burgers franchise implemented a number of production process changes to improve service time at the drive-through window. It provided all employees with more training across all restaurant functions, improved the headset system, improved the equipment layout, developed clearer signs for customers, streamlined the menu, and initiated even-dollar (tax-inclusive) pricing to speed the payment process. Most importantly, the restaurant installed large, visible electronic timers that showed how long a customer was at the window. This not only allowed the quality team to measure service speed but also provided employees with a constant reminder that a customer was waiting.
These quality improvements were implemented over several months, and their effect was immediate. Service speed was obviously improved, and market share at the Charlotte restaurant increased by 5%. To maintain quality service, make sure the service time remained fast, and continue to improve service, the quality team decided to use a statistical process control chart on a continuing basis. They collected six service time observations daily over a 15-day period, as follows:
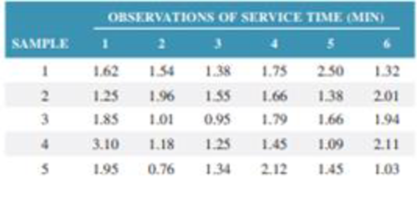
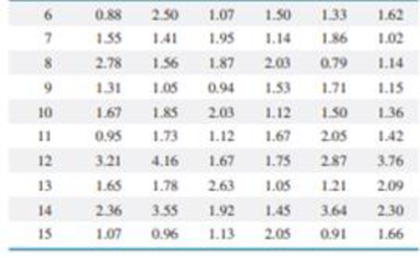
Construct a control chart to monitor the service at the drive-through window. Determine if your control chart can be implemented on a continuing basis or if additional observations need to be collected. Explain why the chart you developed can or cannot be used. Also discuss what other statistical process control charts Dave’s Burgers might use in its overall quality-management program.
Want to see the full answer?
Check out a sample textbook solution
Chapter 3 Solutions
OPERATIONS AND SUPPLY CHAIN MANAGEMENT
Additional Business Textbook Solutions
Principles of Operations Management: Sustainability and Supply Chain Management (10th Edition)
Business in Action (8th Edition)
Operations Management, Binder Ready Version: An Integrated Approach
Operations Management: Processes and Supply Chains (12th Edition) (What's New in Operations Management)
Operations Management: Sustainability and Supply Chain Management (12th Edition)
Business in Action


- BlueMoon Bottlers has a bottle-filling process with a mean value of 64 ounces and a standard deviation of 8 ounces. Suppose the upper and lower specification limits are 71 and 57 ounces, respectively. What is the process capability index of this process? (Note: You MUST show every single step and detailed derivation for full credit)arrow_forwardDesigning an x -Chart Using the Process Standard DeviationThe Sunny Dale Bank monitors the time required to serve customers at the drive-through window because it is an important quality factor in competing with other banks in the city. After analyzing the data gathered in an extensive study of the window operation, bank management determined that the mean time to process a customer at the peak demand period is 5 minutes, with a standard deviation of 1.5 minutes. Management wants to monitor the mean time to process a customer by periodically using a sample size of six customers. Assume that the process variability is in statistical control. Design an x-chart that has a type I error of 5 percent. That is, set the control limits so that there is a 2.5 percent chance a sample result will fall below the LCL and a 2.5 percent chance that a sample result will fall above the UCL. After several weeks of sampling, two successive samples came in at 3.70 and 3.68 minutes, respectively. Is the…arrow_forward3.1.The Great North Woods Clothing Company sells specialty outdoor clothing through its catalog. A quality problem that generates customer complaints occurs when a warehouse employee fills an order with the wrong items. The company has decided to implement a process control plan by inspecting the ordered items after they have been obtained from the warehouse and before they have been packaged. The company has taken 30 samples (during a 30-day period), each for 100 orders, and recorded the number of defective orders in each sample, as follows Sample Number of Defectives Sample Number of Defectives 1 12 16 6 2 14 17 3 3 10 18 7 4…arrow_forward
- 4. C-Spec, Inc., is attempting to determine whether an existing machine is capable of milling an engine part that has a key specification of 4 ± 0.003 inches. After a trial run on this machine, C-Spec has determined that the machine has a sample mean of 4.001 inches with a standard deviation of 0.002 inch. a. Calculate the capability ratio for this machine. b. Calculate the capability index for this machine c. Should C-Spec use this machine to produce this part? d. Explain why? e. Show computationarrow_forwardFearless Inc. has designed and tested 400 Super Sucker Vacuum Cleaner models. All of them were operated for 1,000 hours at Lubbock's Fearless test facility. Out of all the vacuums 2 of them failed during the test. One of them after 900 hours and the other after 500 hours. What is this product estimated Mean Time Between Failures?arrow_forwardAn automobile manufacturer plans to spend one billion dollars to improve the quality of a new model. The manufacturer expects the quality improvement program to eliminate the need for recall and reduce the costs for warranty repairs. The manufacturer’s experience has been, on average, 1.5 recalls for each new model at a cost of $300 per vehicle per recall. The average cost per recall, if one is needed, is expected to increase by 10% for the new model. Costs for other warranty repairs are expected to decrease from $200 to $80 per unit. Sales of the new model were expected to be 500,000 units without the quality-improvement program. The firm believes that the proposed, well-advertised quality program expected to cost an additional $50 million will increase total sales to 650,000 units. The gross profit per unit on the new model sold is $5,000. Required: Would you recommend the proposed quality-improvement program? Please show all your computations to support your answer.arrow_forward
- C-Spec, Inc., is attempting to determine whether an existing machine is capable of milling an engine part that has a key specification of 4 ± .003 inches. After a trial run on this machine, C-Spec has determined that the machine has a sample mean of 4.001 inches witha standard deviation of .002 inch. (Answer in Appendix D)a. Calculate the Cpk for this machine.b. Should C-Spec use this machine to produce this part? Why?arrow_forwardAbernathy, Inc., produces two different generators and is concerned about their quality. The company has identified the following quality activities and costs associated with the two products: Generator A Generator B Units produced 170,000 340,000 Warranty work (units) 1,700 850 Scrapped units (number) 3,400 850 Inspection (hours) 3,400 1,700 Quality training (hours) 85 85 Activities: Performing warranty work $816,000 Scrapping units 612,000 Inspecting 306,000 Quality training 85,000 Required: 1. Calculate the quality cost per unit for each product, and break this unit cost into quality cost categories. If required, round your answers to the nearest cent. Generator A Generator B Unit cost $fill in the blank 1 $fill in the blank 2arrow_forwardBoston Electric Generators has been getting manycomplaints from its major customer, Home Station, about thequality of its shipments of home generators. Daniel Shimshak,the plant manager, is alarmed that a customer is providing himwith the only information the company has on shipment quality.He decides to collect information on defective shipments througha form he has asked his drivers to complete on arrival at customers'stores. The forms for the first 279 shipments have been turnedin. They show the following over the past 8 weeks: Even though Daniel increased his capacity by adding more workersto his normal contingent of 30, he knew that for many weekshe exceeded his regular output of 30 shipments per week. Areview of his turnover over the past 8 weeks shows the following: a) Develop a scatter diagram using total number of shipmentsand…arrow_forward
- A common problem that many drivers encounter is a car that will not start. Create a i shbone diagram to assist in the diagnosis of the potential causes of this problem.arrow_forwardThe production manager at Sunny Soda, Inc., is interested in tracking the quality of the company’s 12-ounce bottle filling line. The bottles must be filled within the tolerances set for this product because the dietary information on the label shows 12 ounces as the serving size. The design standard for the product calls for a fill level of 12.00 ± 0.10 ounces. The manager collected the following sample data (in fluid ounces per bottle) on the production process: Observation Sample 1 2 3 4 1 2 3 4 5 6 7 8 9 10 11 12 13 14 15 12.00 11.91 11.89 12.10 12.08 11.94 12.09 12.01 12.00 11.92 11.91 12.01 11.98 12.02 12.00 11.97 11.94 12.02 12.09 11.92 11.98 12.00 12.04 11.96 11.94 11.99 12.00 11.99 12.00 12.05 12.10 12.10 11.97 12.05 12.12 12.06 12.00 11.99 11.97 12.09 12.05 12.06 12.06 12.05 12.01 12.08 11.96 11.99 11.95 12.05 12.08 12.03 11.95 12.03 12.00 12.10 11.97 12.03 11.95 11.97 a. Are the process average and range in statistical control?b. Is the process capable…arrow_forwardOne of the stages in the process of making denim cloth at the Southern Mills Company is to spin cotton yarn onto spindles for subsequent use in the weaving process. Occasionally the yarn breaks during the spinning process, and an operator ties it back together. Some number of breaks is considered normal; however, too many breaks may mean that the yarn is of poor quality. In order to monitor this process, the quality-control manager randomly selects a spinning machine each hour and checks the number of breaks during a 15-minute period. Following is a summary of the observations for the past 20 hours. Construct a c-chart using 3 limits for this process and indicate if the process was out of control at any time.arrow_forward
 Practical Management ScienceOperations ManagementISBN:9781337406659Author:WINSTON, Wayne L.Publisher:Cengage,
 Operations ManagementOperations ManagementISBN:9781259667473Author:William J StevensonPublisher:McGraw-Hill Education
 Operations and Supply Chain Management (Mcgraw-hi...Operations ManagementISBN:9781259666100Author:F. Robert Jacobs, Richard B ChasePublisher:McGraw-Hill Education
 Purchasing and Supply Chain ManagementOperations ManagementISBN:9781285869681Author:Robert M. Monczka, Robert B. Handfield, Larry C. Giunipero, James L. PattersonPublisher:Cengage Learning
 Production and Operations Analysis, Seventh Editi...Operations ManagementISBN:9781478623069Author:Steven Nahmias, Tava Lennon OlsenPublisher:Waveland Press, Inc.