
Videos
Scattergraph Method
Refer to the information for Luisa Crimini above.
Required:
CONCEPTUAL CONNECTION Prepare a scattergraph based on Luisa’s data. Use monthly cost for the vertical axis and number of appointments for the horizontal axis. Based on an examination of the scattergraph, does there appear to be a linear relationship between the cost of tanning services and the number of appointments?
Use the following information for Exercises 3-44 through 3-46:
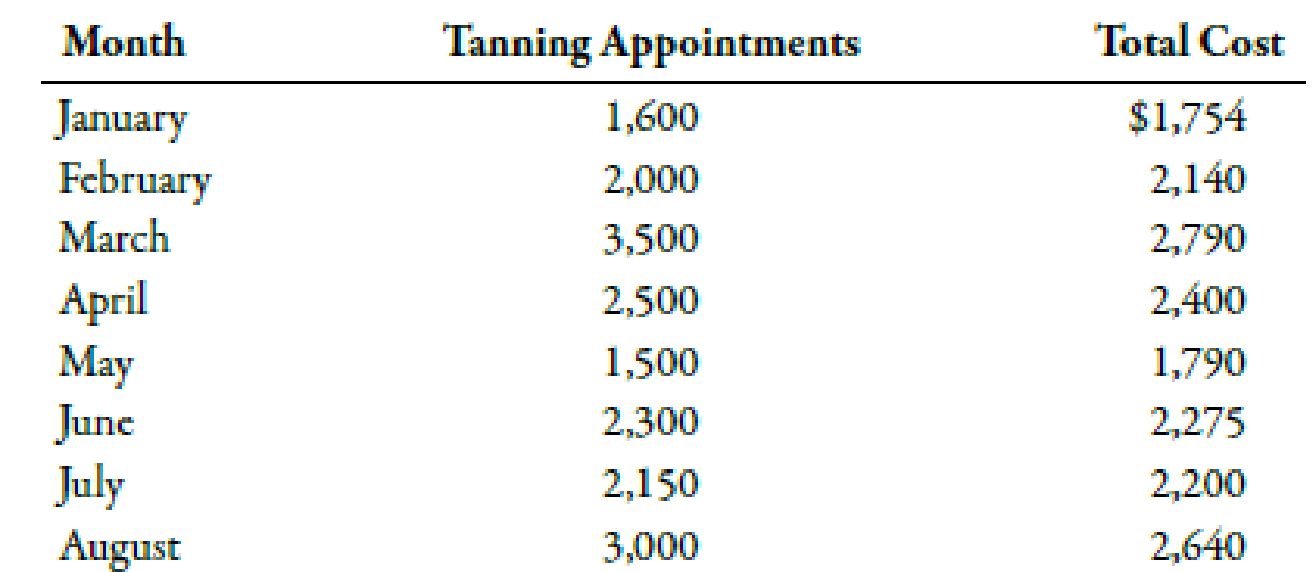
Luisa Crimini has been operating a beauty shop in a college town for the past 10 years. Recently, Luisa rented space next to her shop and opened a tanning salon. She anticipated that the costs for the tanning service would primarily be fixed, but found that tanning salon costs increased with the number of appointments. Costs for this service over the past 8 months are as follows:

Trending nowThis is a popular solution!

Chapter 3 Solutions
Managerial Accounting: The Cornerstone of Business Decision-Making


- Method of Least Squares Refer to the information for Luisa Crimini on the previous page. Required: 1. Using a computer spreadsheet program such as Excel, run a regression on these data. Based on the regression output, write the cost formula for tanning. (Note: Round the fixed cost to the nearest dollar and the variable rate to the nearest cent.) 2. Using the formula computed in Requirement 1, what is the predicted cost of tanning services for September for 2,500 appointments? Use the following information for Exercises 3-44 through 3-46: Luisa Crimini has been operating a beauty shop in a college town for the past 10 years. Recently, Luisa rented space next to her shop and opened a tanning salon. She anticipated that the costs for the tanning service would primarily be fixed, but found that tanning salon costs increased with the number of appointments. Costs for this service over the past 8 months are as follows:arrow_forwardMethod of Least Squares, Predicting Cost for Different Time Periods from the One Used to Develop a Cost Formula Refer to the information for Farnsworth Company on the previous page. However, assume that Tracy has used the method of least squares on the receiving data and has gotten the following results: Required: 1. Using the results from the method of least squares, prepare a cost formula for the receiving activity. 2. Using the formula from Requirement 1, what is the predicted cost of receiving for a month in which 1,450 receiving orders are processed? (Note: Round your answer to the nearest dollar.) 3. Prepare a cost formula for the receiving activity for a quarter. Based on this formula, what is the predicted cost of receiving for a quarter in which 4,650 receiving orders are anticipated? Prepare a cost formula for the receiving activity for a year. Based on this formula, what is the predicted cost of receiving for a year in which 18,000 receiving orders are anticipated?arrow_forwardHigh-Low Method Refer to the information for Luisa Crimini above. Required: 1. Which month represents the high point? The low point? 2. Using the high-low method, compute the variable rate for tanning. Compute the fixed cost per month. 3. Using your answers to Requirement 2, write the cost formula for tanning services. 4. Calculate the total predicted cost of tanning services for September for 2,500 appointments using the formula found in Requirement 3. Of that total cost, how much is the total fixed cost for September? How much is the total predicted variable cost for September? 5. CONCEPTUAL CONNECTION Identify and briefly explain any additional issues that Luisa might be wise to consider when using the high-low method to estimate the costs of her tanning salon.arrow_forward
- Using the data in P4-2 and Microsoft Excel: 1. Separate the variable and fixed elements. 2. Determine the cost to be charged to the product for the year. 3. Determine the cost to be charged to factory overhead for the year. 4. Determine the plotted data points using Chart Wizard. 5. Determine R2. 6. How do these solutions compare to the solutions in P4-2 and P4-3? 7. What does R2 tell you about this cost model?arrow_forwardScattergraph, High-Low Method, and Predicting Cost for a Different Time Period from the One Used to Develop a Cost Formula Refer to the information for Farnsworth Company on the previous page. Required: 1. Prepare a scattergraph based on the 10 months of data. Does the relationship appear to be linear? 2. Using the high-low method, prepare a cost formula for the receiving activity. Using this formula, what is the predicted cost of receiving for a month in which 1,450 receiving orders are processed? 3. Prepare a cost formula for the receiving activity for a quarter. Based on this formula, what is the predicted cost of receiving for a quarter in which 4,650 receiving orders are anticipated? Prepare a cost formula for the receiving activity for a year. Based on this formula, what is the predicted cost of receiving for a year in which 18,000 receiving orders are anticipated? Use the following information for Problems 3-60 and 3-61: Farnsworth Company has gathered data on its overhead activities and associated costs for the past 10 months. Tracy Heppler, a member of the controllers department, has convinced management that overhead costs can be better estimated and controlled if the fixed and variable components of each overhead activity are known. One such activity is receiving raw materials (unloading incoming goods, counting goods, and inspecting goods), which she believes is driven by the number of receiving orders. Ten months of data have been gathered for the receiving activity and are as follows:arrow_forwardOhio Logistics manages the logistical activities for firms by matching companies that need products shipped with carriers that can provide the best rates and best service for the companies. Ohio Logistics is very concerned that its carriers deliver their customers material on time, so it carefully monitors the percentage of on-time deliveries. The following table contains a list of the carriers used by Ohio Logistics and the corresponding on-time percentages for the current and previous years. a. Sort the carriers in descending order by their current years percentage of on-time deliveries. Which carrier is providing the best service in the current year? Which carrier is providing the worst service in the current year? b. Calculate the change in percentage of on-time deliveries from the previous to the current year for each carrier. Use Excels conditional formatting to highlight the carriers whose on-time percentage decreased from the previous year to the current year. c. Use Excels conditional formatting tool to create data bars for the change in percentage of on-time deliveries from the previous year to the current year for each carrier calculated in part b. d. Which carriers should Ohio Logistics try to use in the future? Why?arrow_forward
- This information was collected for the first year of manufacturing for Appliance Apps: Prepare an income statement under variable costing, and prepare a reconciliation to the income under the absorption method.arrow_forwardProduct costing and decision analysis for a service company Pleasant Stay Medical Inc. wishes to determine its product costs. Pleasant Stay offers a variety of medical procedures (operations) that are considered its products. The overhead has been separated into three major activities. The annual estimated activity costs and activity bases follow: Total patient days are determined by multiplying the number of patients by the average length of stay in the hospital. A weighted care unit (wcu) is a measure of nursing effort used to care for patients. There were 192,000 weighted care units estimated for the year. In addition, Pleasant Stay estimated 6,000 patients and 27,000 patient days for the year. (The average patient is expected to have a a little more than a four-day stay in the hospital.) During a portion of the year, Pleasant Stay collected patient information for three selected procedures, as follows: Private insurance reimburses the hospital for these activities at a fixed daily rate of 406 per patient day for all three procedures. Instructions Determine the activity rates. Determine the activity cost for each procedure. Determine the excess or deficiency of reimbursements to activity cost. Interpret your results.arrow_forwardWeber Valley Regional Hospital has collected data on all of its activities for the past 16 months. Data for cardiac nursing care follow: Required: 1. Using the high-low method, calculate the variable rate per hour and the fixed cost for the nursing care activity. 2. Run a regression on the data, using hours of nursing care as the independent variable. Predict cost for the cardiac nursing care for September Year 2 if 1,400 hours of nursing care are forecast. Evaluate the regression equation. How comfortable are you with the predicted cost for September Year 2? 3. Upon looking into the events that happened at the end of Year 1, you find that the cardiology ward bought a cardiac-monitoring machine for the nursing station. Administrators also decided to add a new supervisory position for the evening shift. Monthly depreciation on the monitor and the salary of the new supervisor together total 10,000. Now, run two regression equations, one for the observations from Year 1 and the second using only the observations for the eight months in Year 2. Discuss your findings. What is your predicted cost of the cardiac nursing care activity for September Year 2?arrow_forward
- This information was collected for the first year of manufacturing for Wifi Apps: Prepare an income statement under variable costing and prepare a reconciliation to the income under the absorption method.arrow_forwardMethod of Least Squares, Developing and Using the Cost Formula The method of least squares was used to develop a cost equation to predict the cost of receiving purchased parts at a video game manufacturer. Ninety-six data points from monthly data were used for the regression. The following computer output was received: Intercept 175,600 Slope 455 The cost driver used was number of parts inspected. Required: 1. What is the cost formula? Total cost of receiving = $ + ( $ × ) 2. Using the cost formula from Requirement 1, identify each of the following: independent variable, dependent variable, Variable rate per professional hour, and fixed cost per month. Independent variable Dependent variable Variable rate per professional hour per part inspected Fixed cost per month 3. Using the cost formula, predict the cost of receiving for a month in which 7,200 parts are inspected. Total cost of receiving = $arrow_forwardMethod of Least Squares, Developing and Using the Cost Formula The method of least squares was used to develop a cost equation to predict the cost of receiving purchased parts at a video game manufacturer. Ninety-six data points from monthly data were used for the regression. The following computer output was received: Intercept 147,400 Slope 210 The cost driver used was number of parts inspected. Required: 1. What is the cost formula? Total cost of receiving = $ + ( $ × ) 2. Using the cost formula from Requirement 1, identify each of the following: independent variable, dependent variable, Variable rate per professional hour, and fixed cost per month. Independent variable Dependent variable Variable rate per professional hour per part inspected Fixed cost per month 3. Using the cost formula, predict the cost of receiving for a month in which 6,800 parts are inspected. Total cost of receiving = $ Identifying the Parts of the Cost Formula;…arrow_forward
 Managerial Accounting: The Cornerstone of Busines...AccountingISBN:9781337115773Author:Maryanne M. Mowen, Don R. Hansen, Dan L. HeitgerPublisher:Cengage Learning
 Cornerstones of Cost Management (Cornerstones Ser...AccountingISBN:9781305970663Author:Don R. Hansen, Maryanne M. MowenPublisher:Cengage Learning
 Financial And Managerial AccountingAccountingISBN:9781337902663Author:WARREN, Carl S.Publisher:Cengage Learning,
 Managerial AccountingAccountingISBN:9781337912020Author:Carl Warren, Ph.d. Cma William B. TaylerPublisher:South-Western College Pub
 Essentials of Business Analytics (MindTap Course ...StatisticsISBN:9781305627734Author:Jeffrey D. Camm, James J. Cochran, Michael J. Fry, Jeffrey W. Ohlmann, David R. AndersonPublisher:Cengage Learning
 Excel Applications for Accounting PrinciplesAccountingISBN:9781111581565Author:Gaylord N. SmithPublisher:Cengage Learning